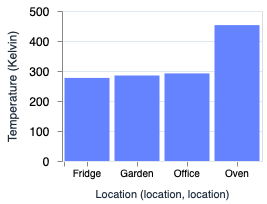
For reasons I’ve been using the VegaLite to produce histograms and I’ve run into problems when I want an origin other than zero. For example, let’s say I’m interested in temperatures around the house in Kelvin.
data = [
  %{location: "Fridge", temp: "277"},
  %{location: "Office", temp: "292"},
  %{location: "Garden", temp: "285"},
  %{location: "Oven", temp: "453"}
]
Everything is fine if I go with the default Y scale.
Vl.new(width: 200, height: 159)
|> Vl.data_from_values(data)
|> Vl.mark(:bar)
|> Vl.encode_field(:x, "location", title: "Location (location, location)", axis: [label_angle: 0])
|> Vl.encode_field(:y, "temp", type: :quantitative, title: "Temperature (Kelvin)")
But my house rarely approaches absolute zero so I’d like to truncate the Y axis. From the VegaLite docs it looks like scale: [domain: [low, high]] should be just the job but the bars still want to start at zero.
Vl.new(width: 200, height: 150)
|> Vl.data_from_values(data)
|> Vl.mark(:bar)
|> Vl.encode_field(:x, "location", title: "Location (location, location)", axis: [label_angle: 0])
|> Vl.encode_field(:y, "temp",
  type: :quantitative,
  title: "Temperature (Kelvin)",
  scale: [domain: [263, 500]]
)
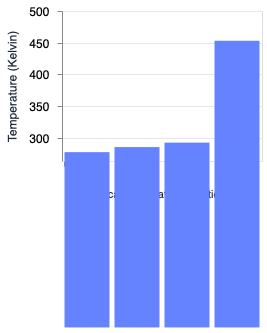
Not pretty. I’ve tried fiddling with things like range but I can’t seem to do anything but occasionally end up with Stranger Things style upside down or compressed chart.
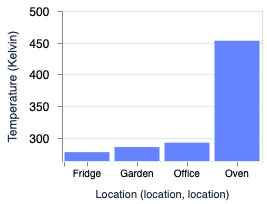
What does seem to help is adding an aggregate value but that seems hacky and impacts things like the toolbar text (which I can’t seem to change through the Elixir).
Vl.new(width: 200, height: 150)
|> Vl.data_from_values(data)
|> Vl.mark(:bar)
|> Vl.encode_field(:x, "location", title: "Location (location, location)", axis: [label_angle: 0])
|> Vl.encode_field(:y, "temp",
  type: :quantitative,
  title: "Temperature (Kelvin)",
  scale: [domain: [263, 500]],
  aggregate: :max
)
Does anyone have any other ideas? (Apart from use Celsius - it’s a placeholder for a different genuine reason to want to truncate the y axis).


