I am working on a project which creates more than 1500 processes.
It uses Phoenix Framework and GenStage.
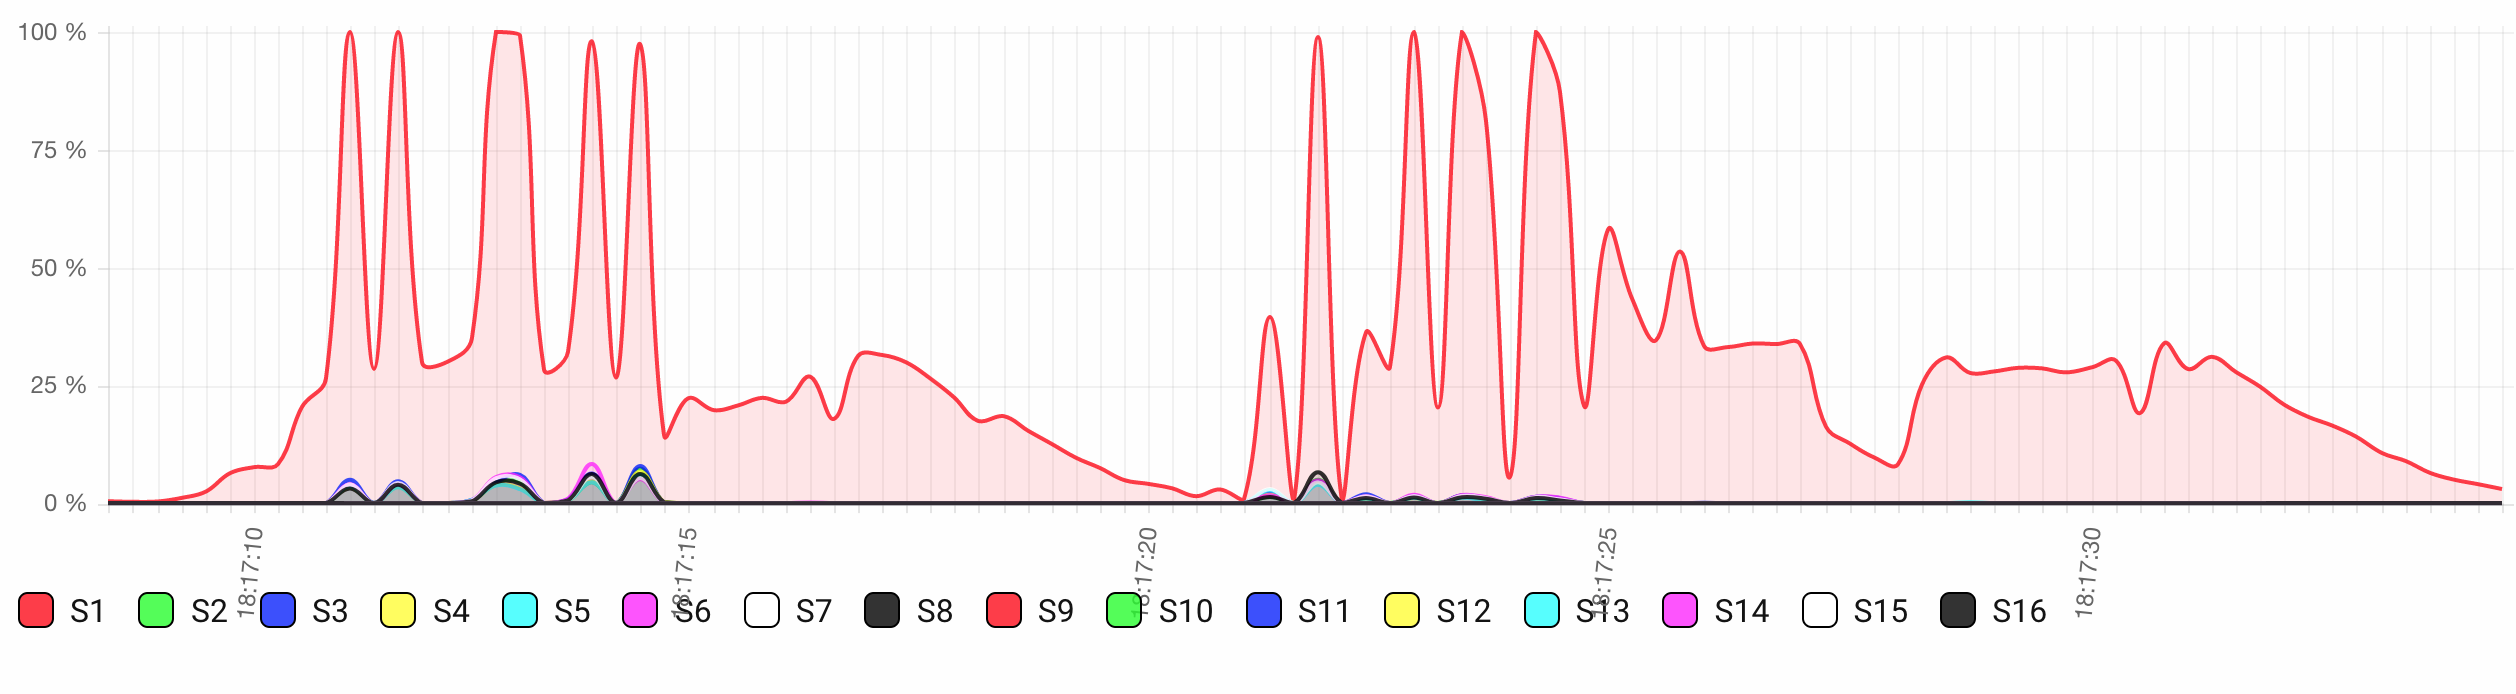
When I tested some sort of load test, I realize the core #1 shows most scheduling work with high usage.
What I understand Elixir should distributes the processes well over all available cores. Why this is happening?
Below attached image show most work assigned to S1 out of 16 cores.
This depends on how you have your code structured. It looks like you may have a single process bottleneck, but without seeing more of your code it’s a bit hard to say more than that.
In order for me to answer this question I need to know what your application does. You said you’re doing GenStage, can you show the code of how you’re using GenStage?
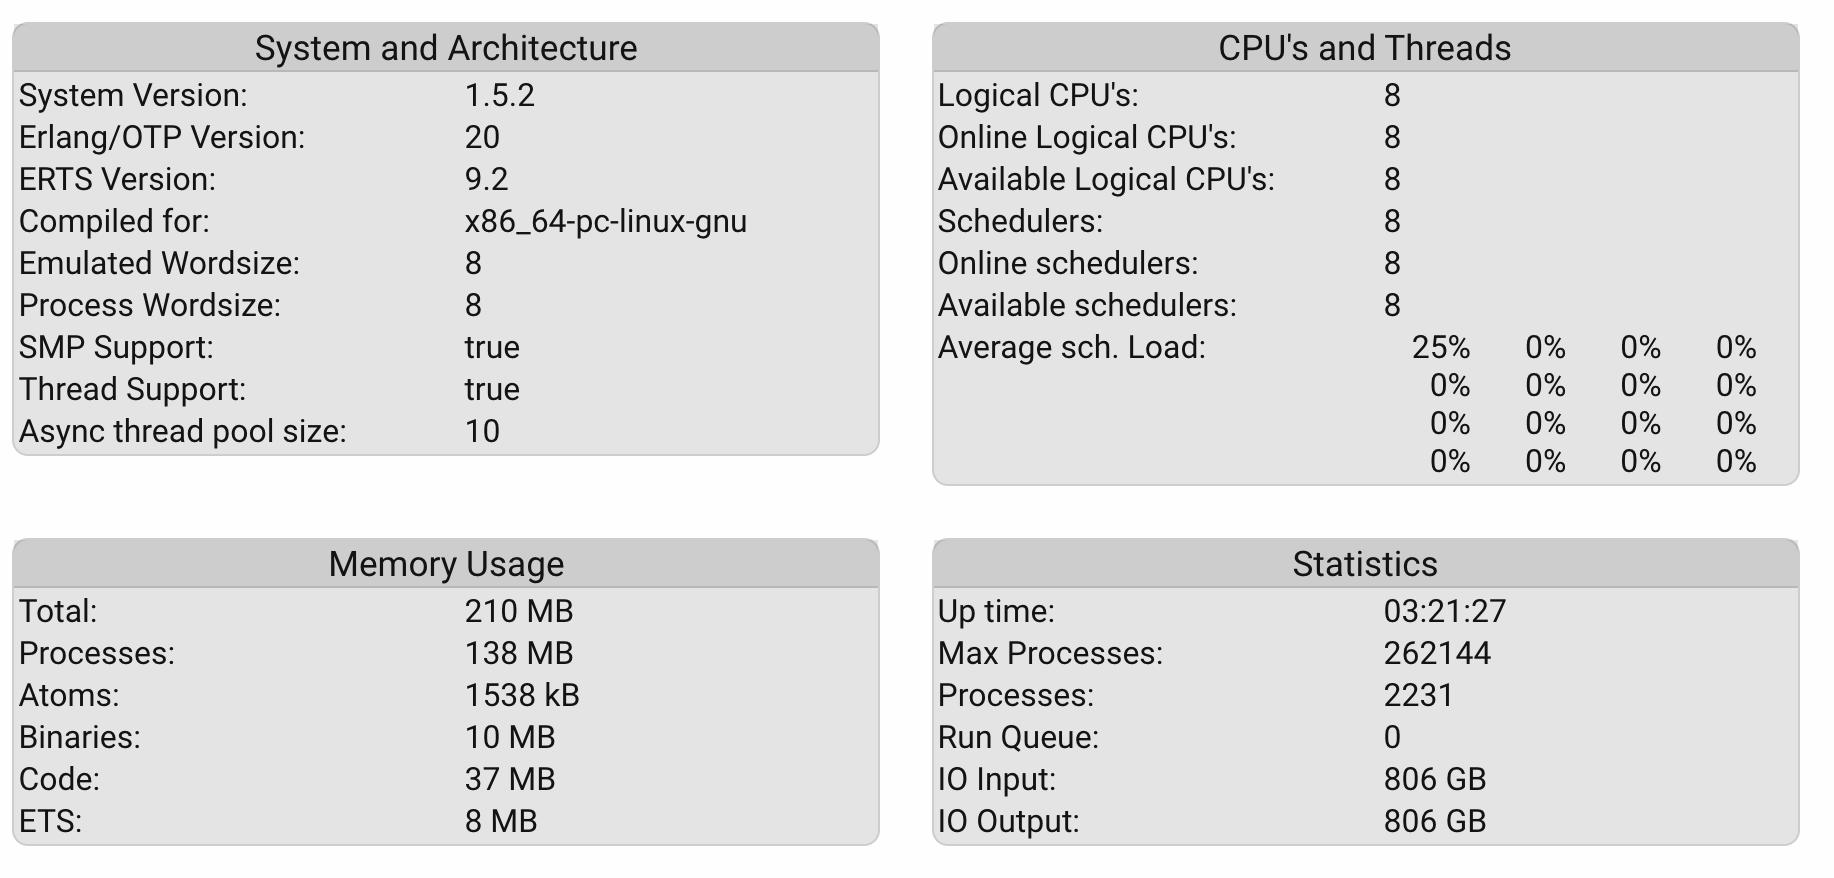
Maybe this can make it clearer for you: the fact you have 2231 does imply these processes are processing something. In fact, as you could see in your workload chart, most of them were just doing nothing (probably waiting for a message), and this is actually good for you!
The thing @benwilson512 is trying to explain is: just creating multiple processes does not necessarily makes your code run in parallel. Here is an example of a very basic code which executes totally in parallel:
for i <- 1..4 do
  spawn fn ->
    for j <- 1..50_000 do
      IO.inspect {i, j}
    end
  end
end
So the code start 4 processes, and on each process, it iterates from 1 to 50_000 and prints it on the screen. So here is how the load chart looks like when running it:
As you can see, all the schedulers worked, to get this 4 processes running. That’s because all 4 processes actually had something to be done at the same time. In your case, probably you have 1 process which is doing a lot of work, and 2230 that are just waiting for someone to send messages to them.
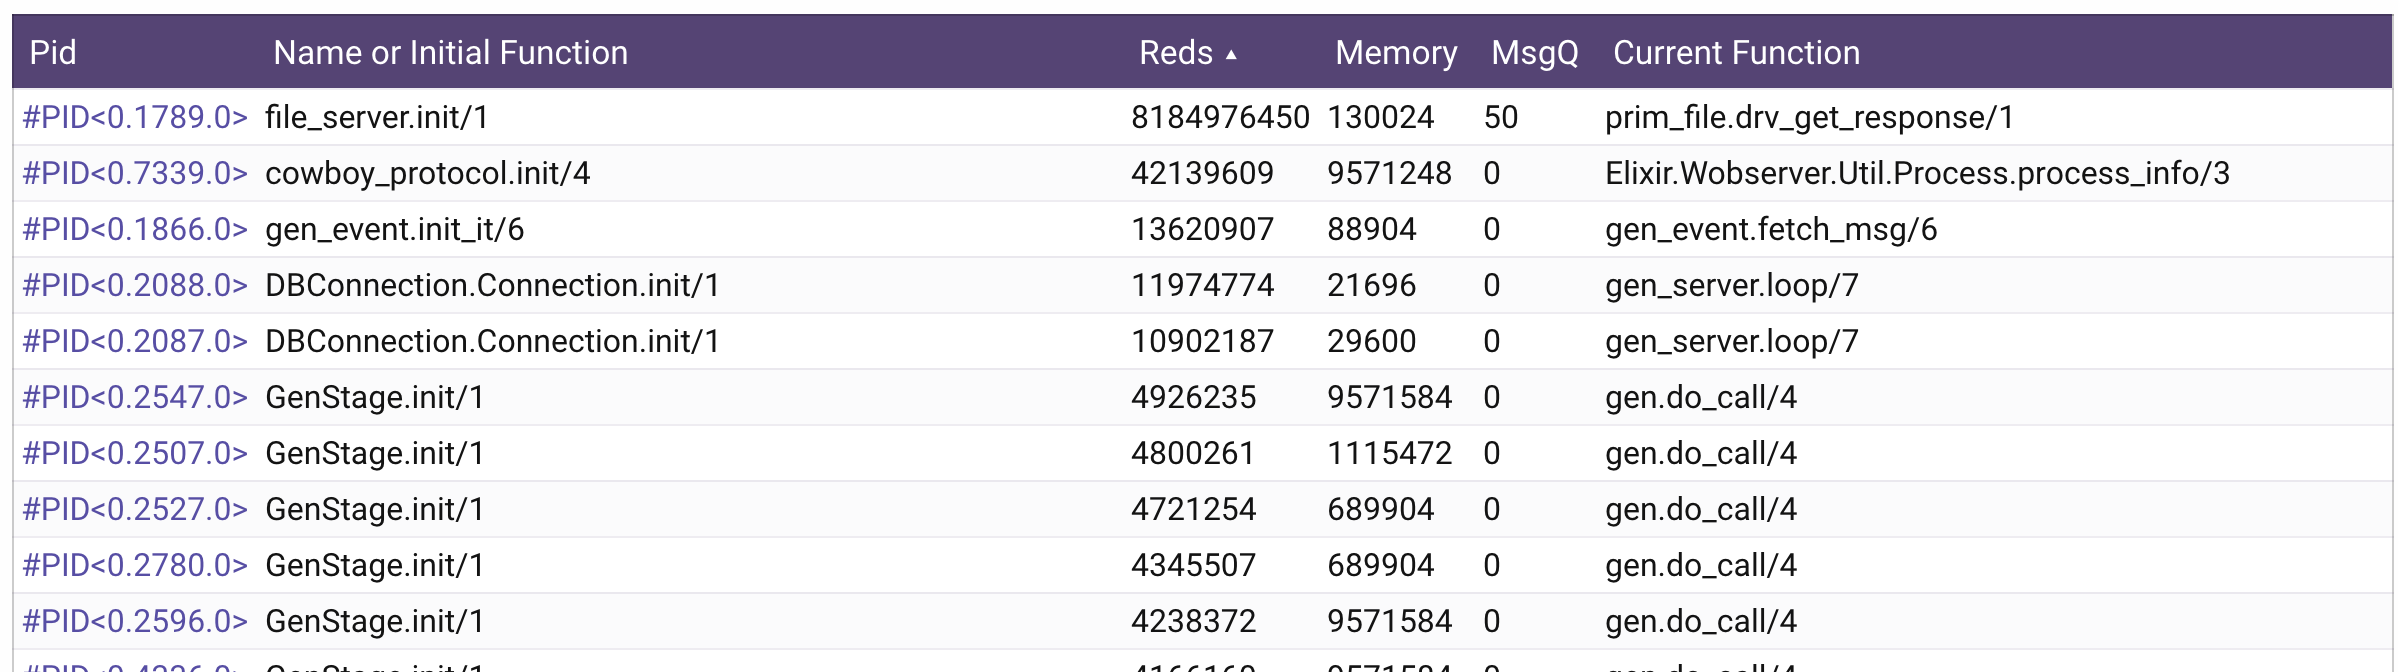
Can you sort your processes by number of reductions? That should give you some understanding of how much work each process is doing. It isn’t perfect, but the higher the reduction count, the more work the process is doing. So, if one process has a much higher reduction count, it is most likely doing the majority of the work in your system and it will not be spread out over multiple cores. This is what @benwilson512 was reffering to when he mentioned possibly having a bottleneck.
Not only does it have the most reductions but it also still has 50 messages in the message queue - i.e. despite everything it can’t keep up with the demand placed on it.
this type of situation
a name like file_server
suggests to me that all file IO is handled by this one process and not only that - this one process is actually doing all the file IO itself in a sequential manner.
If this is the case, as a first step, I would look into moving the file IO out of the “file_server”. Instead it should just spawn a separate process for each file operation; example “file copy”:
Spawn a new process indicating the particulars of the file copy (and the PID of the process that requested it)
That process does nothing other than copying that one file.
Once the copy is complete the process could send a message to the process which requested the copy in the first place that the file has been copied - and then the copy process should exit.
and do the same to the to your remaining file operations.
Now your file operations may in fact be more complicated than that - a logical unit of work may in fact be a “sequence” of file operations but the principle still holds - every time a “unit of work” comes up give it to a new process that completes it and then exits.
To clarify - file_server is part of OTP - all file IO goes through this module unless you’re using raw files. This architecture allows having one node proxy all file operations to another node, but it indeed might be an efficiency problem. Using raw files, should solve it, though.
I am using LoggerFileBackend library as my file logger. I took a look the code
It opens file and write log and close it for every single log. The file IOs seems not a RAW mode.
What do you think? It could be the reason of the bottle neck?
Have you de-activated logging? If without any logging you get a better CPU usage and this process is not that busy, then yes, its the cause. If though even without logging the problem persists, then it is something else.
But yes, exhaustive logging can become a bottleneck. This is true for nearly every kind of application.
That makes a ton of sense, yes. That library calls File.stat on every log entry. Since the file is not raw, each of these calls goes through the file_server, which is a unique process.
I think you can keep your copies as they are for now and rather try to use the default logger and redirect stdout to a file, if you can, to remove the dependency on this library. Making it use a raw file would make the stat calls etc. happen in the logger process rather than file_server, which is a bit more efficient but might just move the bottleneck around…
I don’t think calling IO.read or IO.write on a cooked file involves file_server, rather it goes directly to the file’s I/O server (the pid returned by File.open). The initial call to File.open does use file_server, and so do stat, rename, etc.
Making it use a raw file would make the stat calls etc. happen in the logger process rather than file_server, which is a bit more efficient but might just move the bottleneck around…
True, but at least it will not block other file IOs go to file_sever. My application uses heavy file IO. I guess the file logger possesses file_server and blocks other file IOs. Thus all system performance is negatively impacted.