Hello, I am relatively new to elixir and phoenix and already built a simple website with database integration.
But I noticed that a running phoenix server constantly has in- and outbound network traffic. (Around 700-800 kb/s up and 360-420 kb/s down) Is this normal behavior or is something like telemetry running in the background doing this? And can I disable the component that is causing the traffic if it isn’t necessary for running the website.
There is no telemetry or “phoning home” in any part of the Phoenix stack.
How are you measuring traffic? At the base level you’re going to likely have health checks from your load balancer and keep alive packets to postgres. Beyond that I’d start by looking at your logs and seeing if in fact you have some low level HTTP traffic for some reason.
Thank you for your answers. First off, i have a connection to a PostgreSQL database but why would that need constant traffic? The portainer monitoring shows increasing accumulated traffic every second. That is a bit much for health checks or keep alive packages…
And second: I suspected that there is no “phoning home”, but there is the live dashboard in the starting project which collects data from the running server and I thought that it might be internal monitoring traffic, but now I realized that that should not be part of external traffic.
I first noticed the traffic on the dashboard of railway.app where the network monitor shows that accumulated incoming and outgoing traffic is always rising. And later when I tested locally, I used the dashboard of portainer and in the container with nethogs.
And the logs only show my requests when I explicitly send a GET request to the server (or any other http request).
No, you cannot disable it in a Phoenix server or any other server that you put serving internet traffic, because from the moment your server goes live it will be “bombarded” with requests from bots that run 24/24 scanning all public ips on the internet for misconfigured servers. If you tail your server logs you will find requests to PHP scripts, the most common ones, but requests for other type of servers can be found in the logs. So, you will find outbound traffic, because your Phoenix server will usually reply with a 404 for this request he isn’t configured to reply.
On a public server that might be the case, but i ran the server locally with no port open to the external internet. The only open port was 4000 from docker to my local machine and the logs only show my requests:
12:59:36.260 [info] Running TestWeb.Endpoint with cowboy 2.9.0 at :::4000 (http)
12:59:36.666 [info] Access TestWeb.Endpoint at https://example.com
12:59:41.317 request_id=FzSn6R0EArK2tl4AAASE [info] GET /
12:59:41.327 request_id=FzSn6R0EArK2tl4AAASE [info] Sent 200 in 10ms
12:59:52.672 request_id=FzSn68HXfb5JdskAAAAM [info] GET /
12:59:52.673 request_id=FzSn68HXfb5JdskAAAAM [info] Sent 200 in 507µs
12:59:53.797 request_id=FzSn7AThd0Sl6JAAAABM [info] GET /
12:59:53.797 request_id=FzSn7AThd0Sl6JAAAABM [info] Sent 200 in 490µs
12:59:55.783 request_id=FzSn7HtKUFGIk2EAAACM [info] GET /
12:59:55.784 request_id=FzSn7HtKUFGIk2EAAACM [info] Sent 200 in 574µs
13:00:32.392 request_id=FzSn9QFYBuSF340AAADM [info] GET /
13:00:32.393 request_id=FzSn9QFYBuSF340AAADM [info] Sent 200 in 527µs
13:00:32.889 request_id=FzSn9R7vUQG0AckAAAEM [info] GET /
13:00:32.889 request_id=FzSn9R7vUQG0AckAAAEM [info] Sent 200 in 553µs
13:00:33.222 request_id=FzSn9TLRI9A_qoQAAAFM [info] GET /
13:00:33.223 request_id=FzSn9TLRI9A_qoQAAAFM [info] Sent 200 in 431µs
13:00:33.410 request_id=FzSn9T4HmUwFFhAAAAGM [info] GET /
13:00:33.411 request_id=FzSn9T4HmUwFFhAAAAGM [info] Sent 200 in 469µs
13:00:33.545 request_id=FzSn9UYHDqAc8kgAAAHM [info] GET /
13:00:33.545 request_id=FzSn9UYHDqAc8kgAAAHM [info] Sent 200 in 607µs
13:00:48.942 request_id=FzSn-NvFjB00jycAAAIM [info] GET /
13:00:48.942 request_id=FzSn-NvFjB00jycAAAIM [info] Sent 200 in 580µs
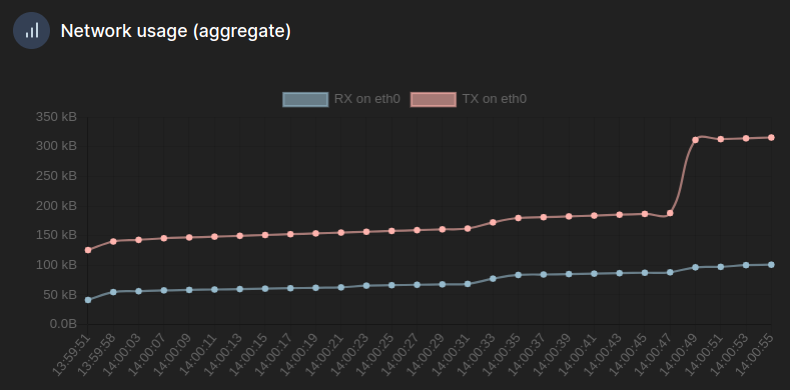
And this is the aggregated network traffic shown by portainer. The bumps are my requests, but as you can see, the graph is always rising and when I logged into the docker container, nethogs showed that there is indeed constant traffic.
So might this really be a constant connection to the PostgreSQL database which is running in a different container on the same local machine?
It is probably no real problem, but it is extremely bothering me that even in a encapsulated minimal environment there is something going on that I don’t really know what it is. I might be a bit burned by memory leaks in C, but when something is doing something while nothing should be active (remember: starting template following the generator on the Phoenix website with no request except my few and the connected PostgreSQL database), I get really nervous.
According to Ecto docs default connection pool_size is 10. That means by default you will have 10 connections open to PostgreSQL all the time. These connections won’t be completely idle because I expect there are some heartbeat stuff at least. I don’t think Ecto supports lazy connections meaning it keeps those connections always connected and doesn’t disconnect them.
Edit: It seems Ecto is pinging PosgreSQL to see that connections are alive