Have you tried manually calling the function in iex? And then do several Cachex.ttl calls and see if the TTL value is decreasing?
I think your problem is that you are calling Cachex.expire inside fetch function and key not be created until you exit that function, It should be done this way.
From ttl option of `Cachex.fetch` · Issue #195 · whitfin/cachex · GitHub
with { :commit, _val } ← Cachex.fetch(:my_cache, cache_key, &my_func/1) do
Cachex.expire(:my_cache, cache_key, :timer.seconds(1)
{ :commit, val }
end
That sounds correct to me. You can also add it to the existing case statement:
Cachex.fetch(:github, "avatar_url", fn() ->
  # ...
|> case do
  {:error, _} -> nil
  {_, nil} -> {:error, :not_found}
  {success, result} when success in [:ok, :loaded, :commit] ->
    if success == :commit, do: Cachex.expire(:github, "avatar_url", :timer.minutes(5))
    result
end
Just an off-topic comment about that case statement: it seems to me that it does not make much sense that you turn {:error, _} to nil but you return {:error, :not_found} if the result is nil. I would try to be consistent there and either return nil or {:error, cause} in both cases, whatever is appropriate.
@wanton7 I think you found the issue  I’ll give that a try.
@lucaong Thanks for the alternative format. Re. the case statement, I found that solution in an issue thread somewhere, and there was some answer as to why it should be that way, but couldn’t really make sense of it.
Hi all,
I now see to have that issue also.
I recently upgraded to
- Elixir 1.17.3
- Also upgraded my host system to the same but just bigger machine
- also upgraded to haproxy latest 3.x version
The app is deployed as a release.
It worked fine the last two years.
Now suddenly the app responds with 503 after a while.
I cannot reproduce it by using the app. The app works totally fine.
- There is nothing in the logs.
- No crash-report
- Checking the app wit
remoteshows the app is up - App has a pid and seems like its running.
- Its not an upstream issue, as requesting from the same machine, I do not get a response from curl.
- It often takes between 2h and 4h for the app to get unresponsive… That might be a hint.
- It also seems to get unresponsive when not used…
- I have live_view dashboard in the project and in production available. there is nothing to see - memory is not increasing. Also should have sufficient resources
Any hints how to approach that? There is no trace or anything. Locally never had this issue.
How is live dashboard working if the node is not serving requests?
Hi @benwilson512 ,
This is interesting. Live Dashboard is still working for a one or a few more minutes.
And then it also starts being unavailable. But later than the other part of the app.
Are you able to get a remote console into the machine after live dashboard stops working?
Yes. I can use remote - and also pid command gives me the pid of the process. So it’s working but not serving. It seems like it did not crash… also logs do not show anything. run_erlang log only contains the regular startup message. And the erlang log contains the last requests. Nothing else.
As it stops working after some time, it sounds like something is growing and finally all runs out of memory. But I do not see that in htop or so…
I did not introduce any new features in the app. Only the updates of elixir version and upgradet all dependencies.
I suspect one of those libs to introduce that.
This is strange. I never had something like this. Erlang elixir is like a diesel engine to me. Either it does not start up and the issue is obvious or it runs forever.
Hey @marschro this is likely related to a dependency and not the core language. The main thing to check is the process message queue, which is a common source of memory build up. This should be visible from the live dashboard quite easily, although I don’t know if it’s a default view from htop. I’m also a big fan of :observer_cli in terms of command line debug views.
Thank you @benwilson512 - I will try to check this. And agree, there must be some dep. introduced that has an issue.
Will continue reporting on this while debugging… happy 2025 ![]()
Oh - awesome - did not know about :observer_cli. Thanks @benwilson512
I now added it to the project and put it in production…
Currently there is nothing special. All looks fine.
@benwilson512 by process message queue you mean message_queue_len column in the processes table, right?
Currently I wait until it gets unresponsive… and as often… now its working fine … arghh… waiting
Okay, update on this.
- The app now stopped working again.
- haproxy upfront responds with 503 as the machine on which the app is serving is not responding.
- Its not an upstream issue, as on the machine, running the app, curling the loopback interface does also not give a response (which it does, when the app is running fine)
- checking the app and the system with
observer_clidoes not show anything special
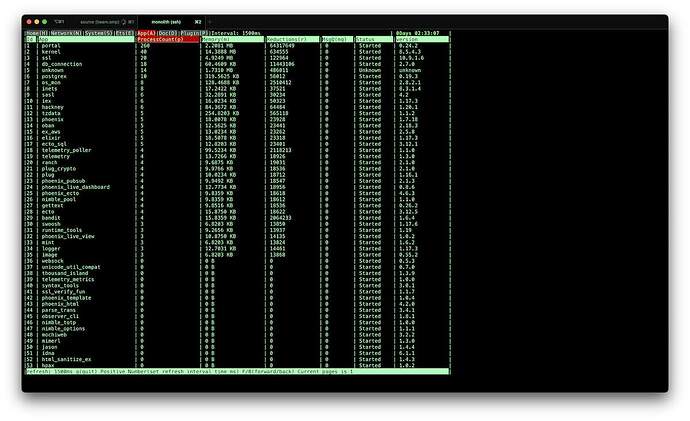
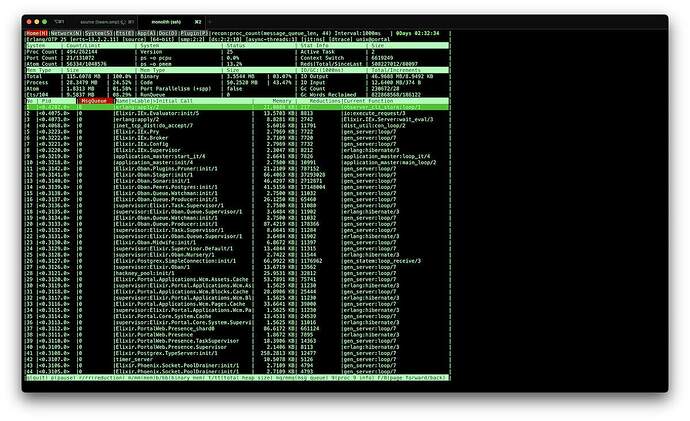
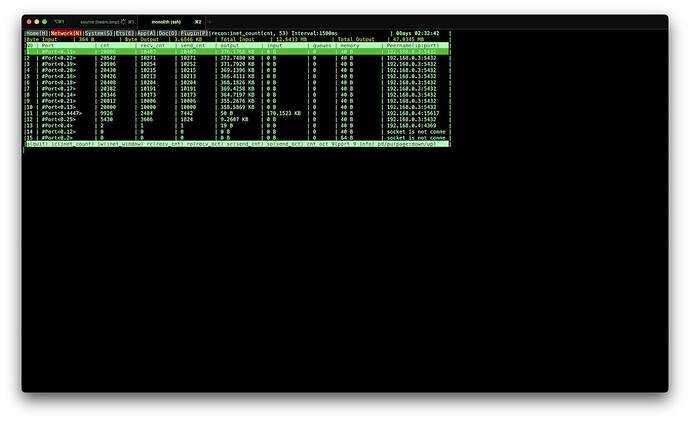
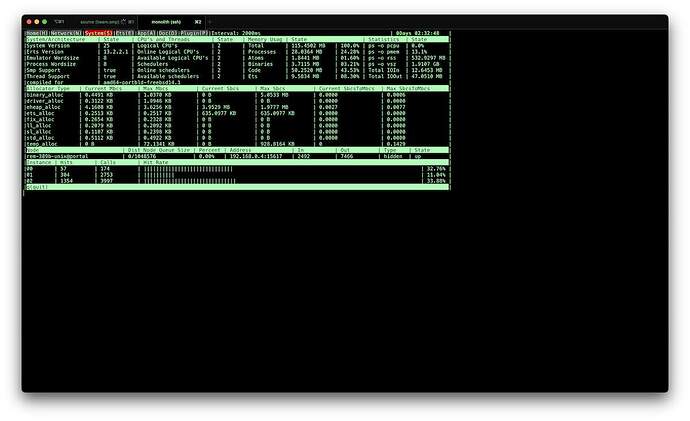
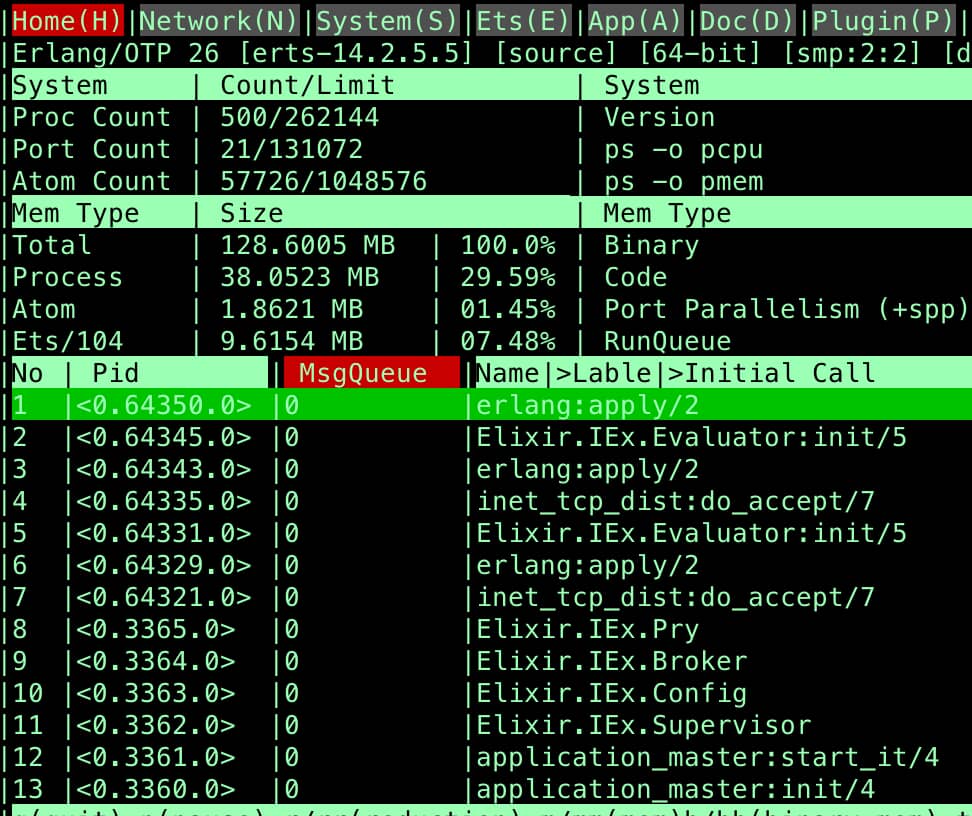
Here some observer_cli views:
I compared the values with those when the app is fine. But there is nothing obvious. All values are pretty much stable. No memory increasing to queue that is increasing…
tmp/log/erlang.log.1 is updating regularly with only this entry - even when app is down…
===== ALIVE Tue Jan 14 18:12:03 CET 2025
This is soooo strange ![]()
Does anyone know, if it’s possible within a running elixir phoenix application to request a route and get the response?
I want to remote into the app and there check, if the app responds to a request, but I guess that’s impossible…
Bandit has an attach_logger/1 function. But in the iex session I cannot reference Bandit…
Any hint appreciated ![]()
Looking at these, did you make sure that to sort the chart by message queue len? If message queue length is not showing anything, be sure to sort by memory as well. What does :erlang.memory show?
Yes, I sorted by queue and also memory. it just idles and nothing piles up…
All message queues are completely empty…
:erlang.memory says:
[
  total: 123234640,
  processes: 28674880,
  processes_used: 28672040,
  system: 94559760,
  atom: 1974649,
  atom_used: 1952484,
  binary: 3697216,
  code: 53739902,
  ets: 10082176
]
… which look like high numbers but should be fine… checking it multiple times, the values grow and shrink a but do not grow further…
I suspect now some network issues and nothing caused by the app.
Because I was rolling back to an older state and it was stilll an issue. It maybe is caused by some OS update and container changes…
… or maybe not. Because restart -ing the app makes it work again. And this clearly does not change any network settings…
Hey @marschro yeah that all looks healthy to me, 123mb is nothing. Restarting the app would still cause the app to release and then re-acquire the port, so some OS level issue with the port could still theoretically be an issue.
Are those screenshots from the period of time where it is not accepting requests?
Are those screenshots from the period of time where it is not accepting requests?
Yes, that was during the time, when the app did not receive and respond to requests…
Ah- that is a good point you mentioned that restart acquires the port…
For me also everything looks like an OS level thingy.
I will investigate further in this direction…
Thank you so much for you inputs @benwilson512 !!!
Some updates on this:
- I rolled back the OS update without success.
- I rolled back HAproxy update from 3.0 to 2.8 without success.
- I build a complete new app from scratch (phx new with auth) and deployed that. This app shows also the exact same behavior. So it’s likely not elixir related but a way more complicated and rare side-effect in combination of elixir app within a FreeBSD jail, behind a HAproxy (manages ssl termination load balancing etc.).
https://playground.devpunx.com
What is super interesting but what I totally do not get:
- When I deploy the app in the freebsd jail, without having in haproxy external access configured to this jail, it does not stop working. I can
curlthe app from within the jail and also from the host system without any problem. - So it’s likely something that happens on network level. Maybe something like haproxy keeps connections open and
Banditat some point starts ignoring that.
- Checking all available logs did not show anything. neither jail logs nor elixir logs nor HAproxy logs. This is totally spooky. Every part for its own works, except of the elixir phoenix app wich gets unresponsive on its port.
Maybe I try switching to cowboy again and check if there is the same issue…
You can try increasing the acceptor pool size of Bandit. New connections are accepted by that pool before being spun out into individual processes. If the proxy manages to keep a hold of all the acceptor processes without them continueing to spin up the connection level processes that would be a problem.
