For anyone following this, it turns out I’m a total idiot… Elixir is handling tens of thousands of elements just fine, as I have just discovered with better benchmarking. Even if each element contains a number of totally not optimised polynomials implemented as structs.
It turns out that unlike what I previously reported, the problem is with typst. Problems start to happen when I try to compile typst files of > 20.000 lines with a large number of graphical objects. To be fair to typst, these files are probably much larger than anything anyone has tried to use typst on (I don’t know whether the critical part is the patching or the rendering, but I’m not that interested in finding out).
Because of this, I have decided to keep the core constraint-based architecture the same and drop typst. I’ll be try to use resvg (the rust svg rendering library, which also has Elixir bindings) for text rendering and measuring and to render SVGs into PNGs. I assume that resvg is probably better optimised than typst for rendering larger numbers of shapes.
The only thing I lose is math typesetting, but it turns out plots don’t use that much math typesetting. One can get by with unicode symbols, superscripts, subscripts and not much else.
I have now refactored the whole library to use resvg as a renderer (and text measurer). The only thing that doesn’t work yet is text rotation. Otherwise, it has feature parity with what I had before.
The figure below, while unimpressive is a plot of 50,000 semi-transparent random dots in a scatter plot, rendered into PNG in less than a second by resvg at a resolution of 300dpi. This confirms to me that resvg is the way to go for both text measurement and rendering.
Now I just have to find a library that can convert SVG into PDF (maybe resvg can do that somehow?) and a way to embed fonts in SVG files so that they are portable. And for full portability, I need to make my linear solver work outside linux. Maybe I can repurpose one of the rust solvers out there with some help.
Quartz now supports some basic tick marks and tick labels. Everything works fine with the linear constrains based system. You can now render several datasets and a new color will be picked automatically for each dataset.
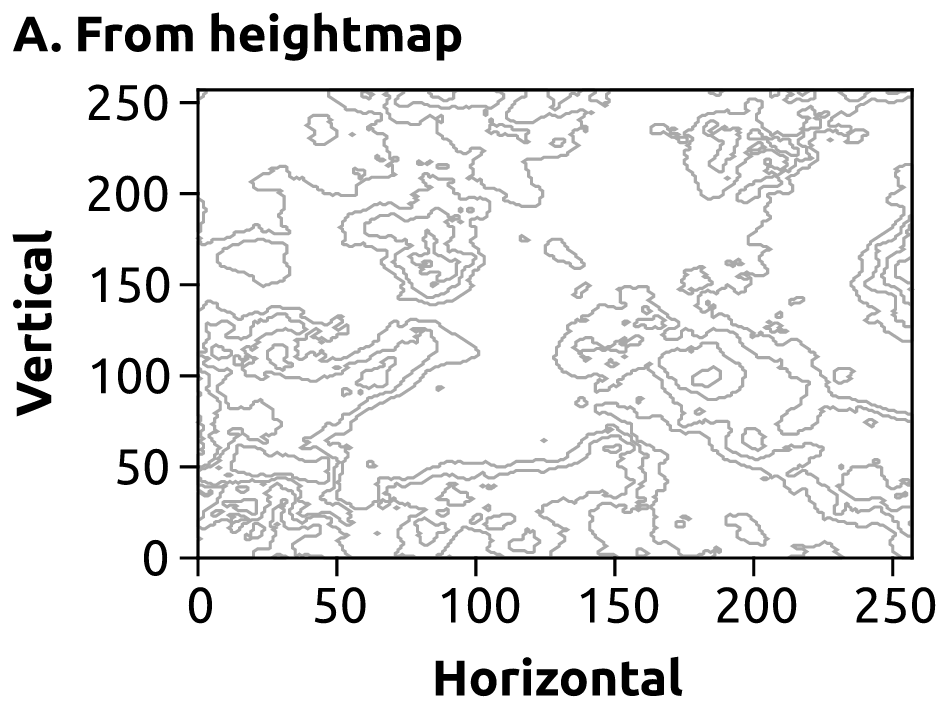
Finally, the contour plot I’ve shown before, but with a much higher resolution now that we don’t depend on typst and can use the more performant (for this use case) resvg renderer (note that we can fake powers of integers with superscript unicode characters, although for more advanced things one really needs proper math typesetting):
Fill-between plot: TODO (easy except when lines cross)
Stack plot: TODO (easy)
Stairs plot: TODO (easy)
Distribution plot:
KDE plot: Done
Histogram: Done
Violin plot: TODO (but it’s just stacking 2 mirrored KDE plots, and it’s a bad type of plot IMO)
Histogram: TODO (easy, but one needs to determine bandwidth)
Event plot: TODO (but easy, just draw lines)
Pie plot: TODO (but a bad style of plot)
Doughnut plot: TODO (not as bad as pie)
Gridded data:
Countours: TODO (currently Quartz only supports lines, not filled areas; supporting this means bringing additional rust dependencies or implementing some really hard code in Elixir)
Heatmaps: TODO (medium difficulty)
Quiver plots: TODO (easy)
Streamplot: TODO (very hard!)
Irregularly gridded data: TODO, and very hard (will probably require additional dependencies)
3D plots: TODO, and very hard - probably out of scope
Math typesetting:
Simple exponents and subscripts: TODO (easy)
Greek letters and special characters: TODO (easy)
Anything more complex: TODO (very hard! maybe it can be made easier if I find a way to bind typst to extract rendered math equations from typst and render it as SVG which can be put into Quartz)
I have finally added support for text segments with different properties (that is, I can now mix regular, italic, bold, subscript, supersscript, etc.) in the same piece of text. This means that text support in Quartz is now arguably more sophisticated than matplotlib. On the other hand, matplotlib supports relatively sophisticated math typesetting, and Quartz doesn’t (yet?).
For example, the new support for different font types allow the title labels to distinguish between normal text and variable names.
Note that we can represent the “non-math” parts using a sans-serif font while using a “fancy” serifs font for the part that attempts to immitate a math formula.
The code that generates the label text is very friendly:
While one could use a markup language for this, generating it with code seems more versatile in the long term, so I’ll probably continue to use code (and to develop some better helpers for math greek letters)
After some (too much?) time dealing with the intrincacies of unicode and with the way common fonts handle unicode math characters in practice, I have now implemented most mathematical alphanumeric mathematical characters. I have implemented them as functions which return the respective character, and not as part of a markup language. Since Quartz is meant to draw figures from Elixir code, I think using elixir code as an input method for mathematrical characters is appropriate. I might implement a markup language in the future though, probably inspired by Typst or LaTeX.
Here is a list with the characters that are currently supported (I had to massibely downgrade the image quality to upload it to the forum, the real quality of the image is much crisper): Quartz.Math — quartz v0.1.0
Big landmark! Quartz can now accurately rotate text, which means it can render actual real-world labels for the Y-axis of plots:
Some questions for whoever may be following this:
What do you think of the choice of using the Sans-Serif Ubuntu font as a default? The license is quite permissive, and it’s certainly prettier than other options such as DejaVu, used by Matplotlib. However, I’ve been thinking of making the default a Serif font, such as Linux Libertine (which I actually use to typeset math characters)
Now that I can support rotation of text and legends, I think that it might be the right time to think about releasing a 0.1 version. What do you think would be the “essential” plot types for an actual release on Hex? I already support the histogram, the KDE for continuous distributions, line plots, scatterplots and “fill-between” plots. For things like survival analysis, plotting a step function is useful (survival functions are usually represented as Kaplan-Meier plots, which are pretty much always displayed as step functions)
Anyone here is interested in diving into the constraint-solving part of things? Currently it works very well, and allow for very useful dynamic layouts in which things “fit into place” magically. The problem is that failures aren’t really debuggable. Is anyone here experienced with Linear programming solvers or other kinds of constraint solvers? When the linear solver fails, the mains problem is that I just raise an error and can’t give the user any feedback on which constraints are causing problems or why. Is there any literature on this? Should I just randomly remove constraints from the problem (with something like a binary search) and try to detect which of them cause problems? The way things are implemented now, there won’t be any constraint-solving problems unless the user creates “raw” constraints using the Figure.assert/1 macro, but I wonder if one can enhance debuggability
For actual real-life plots, how important would it be to support proper mathematical formulas beyond math symbols, subscripts and superscripts? I figure I can probably integrate with Typst to get proper math typesetting, but that would split text handling into two. Or maybe I could integrate with Typst for all text and leave the shape renfering to Quartz
I have published Makeup on Hex, but I’m hitting some space limits on hexdocs (not on hex itself). This is probably mostly because of the images inlcuded in the documentation.
Package published to https://hex.pm/packages/quartz/0.3.0 (5ac61246b71f812030b209eea264f90cc682950fe6f45a8241659d03661856f0)
Publishing docs...
** (MatchError) no match of right hand side value: {:error, {:tarball, {:too_big_uncompressed, 67108864}}}
    (hex 2.1.1) lib/mix/tasks/hex.publish.ex:403: Mix.Tasks.Hex.Publish.build_docs_tarball/1
    (hex 2.1.1) lib/mix/tasks/hex.publish.ex:176: Mix.Tasks.Hex.Publish.create_docs/4
    (hex 2.1.1) lib/mix/tasks/hex.publish.ex:153: Mix.Tasks.Hex.Publish.create/3
    (mix 1.16.0) lib/mix/task.ex:478: anonymous fn/3 in Mix.Task.run_task/5
    (mix 1.16.0) lib/mix/cli.ex:96: Mix.CLI.run_task/2
    /home/tmbb/.asdf/installs/elixir/1.16.0/bin/mix:2: (file)
What exactly is this limit? I can’t find it in the code (I can’t find the source of the probably erlang module that’s saying a limit has been hit). I’d like to know what the limit is to decide whether I’ll somehow try to save some space or whether I should host the docs somehwere else instead. Pinging the hex team because this seems related to hex @Hex-Core-Team
It looks like this line is failing to match. There are a few places (1, 2) in the erlang module that can return :too_big_uncompressed, but the limit TarballMaxUncompressedSize seems to be set from config that is vendored in some way from hex_core. That leads me to this comment that implies a default limit of 134_217_728 bytes (128 * 1024 * 1024), which seems well under your 67_108_864? So maybe hex.pm itself is configured with something below this default maximum?
With this new version, I was finally able to update the docs to hexdocs (API Reference — Quartz v0.8.1) by moving all images to a new website: https://tmbb.github.io/quartz/. This is currently hosted on GitHub pages, but when I have the time, I’ll host it in its own domain. These changes allow me to remain within the size limits of hexdocs.
The plotting API is inspired by Matplotlib. Despite being quite old, Matplotlib is very functional for my needs and makes it very easy to customize the plots, which is important for publication-quality figures.
I really don’t like frameworks which encourage any kind of “grammar of graphics”, which always seem very artificial to me and obscure what would usually be simple plotting commands.
Contributing
I will have a bit more free time in April, and I would like to refactor the code to stabilize the interface and make it easier for external contributors. I think this package could be a good alternative to generate plots for scientific paper or other static media (like Matplotlib). Together with my Ulam package, one can already create, fit and plot Bayesian models, and honestly I prefer to manage Elixir projects as opposed to Python projects (packaging is python projects is rather problematic).
I don’t know if people are still trying to develop an ecosystem for scientific programming in Elixir, but if so, Quartz would be an interesting part of such ecosystem.
I have finally released a SciEx on hex.pm, which means that Quartz can now depend on SciEx, which provides some rust-based goodies which are very intersting, like support for proper contours and isobands (not completely implemented yet) and better KDE algorithms (not implemented in Quartz yet).
Not that the code below uses the SciEx.Float64.Array2 data type from SciEx, which is actually the first good implementation of a 2D array I’ve seen in Elixir (it uses Rust’s ndarray as a backend and it can be made to support matrix multiplications, FFT, etc.)