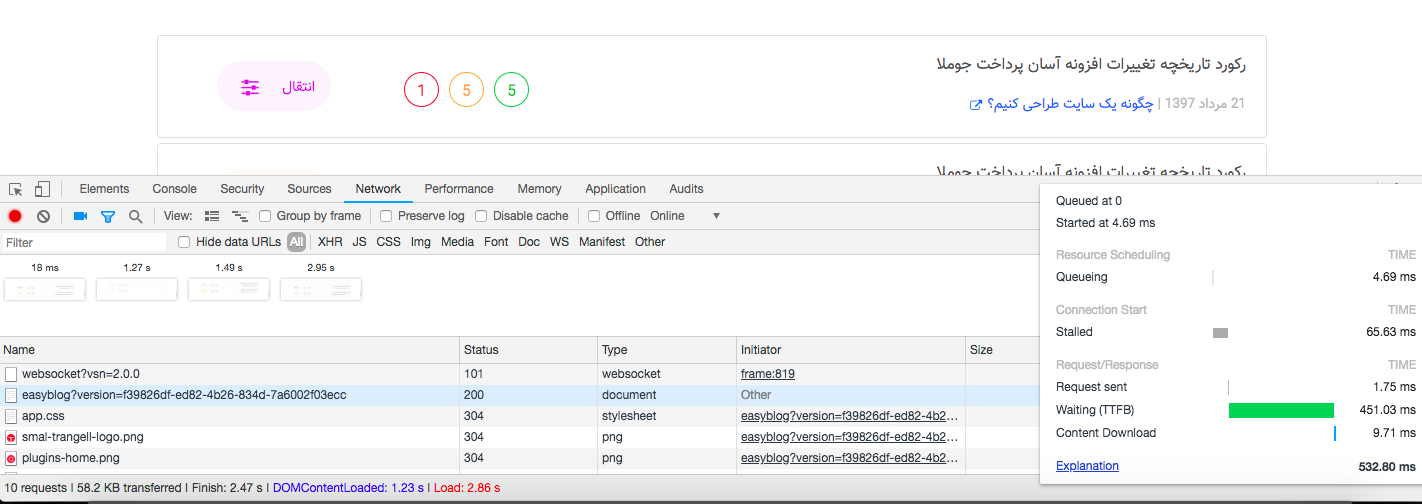
my web app was loaded about 3 s, but in my console it showed me [info] Sent 200 in 294ms
it should be noted Im in developer mode and my computer(local), Why is there many difference in speed between phoenix console and html rendered in browser?
We have ~450ms until the first byte was received from the browser, we also have ~300ms from receiving the process until sending the first byte.
So there are only ~150ms of discrepancy, which in fact seems quite a lot for a local only set up. But is this really local only? Or is there some docker container in between? Is this on windows or linux? Do you have any virusscanners active that might interfere?
This really looks like what I experienced when I used to push prod Elixir on Windows behind IIS, so I am also very curious if that is Windows or linux and if any front-loading server, like IIS? I don’t get those kind of times on linux.
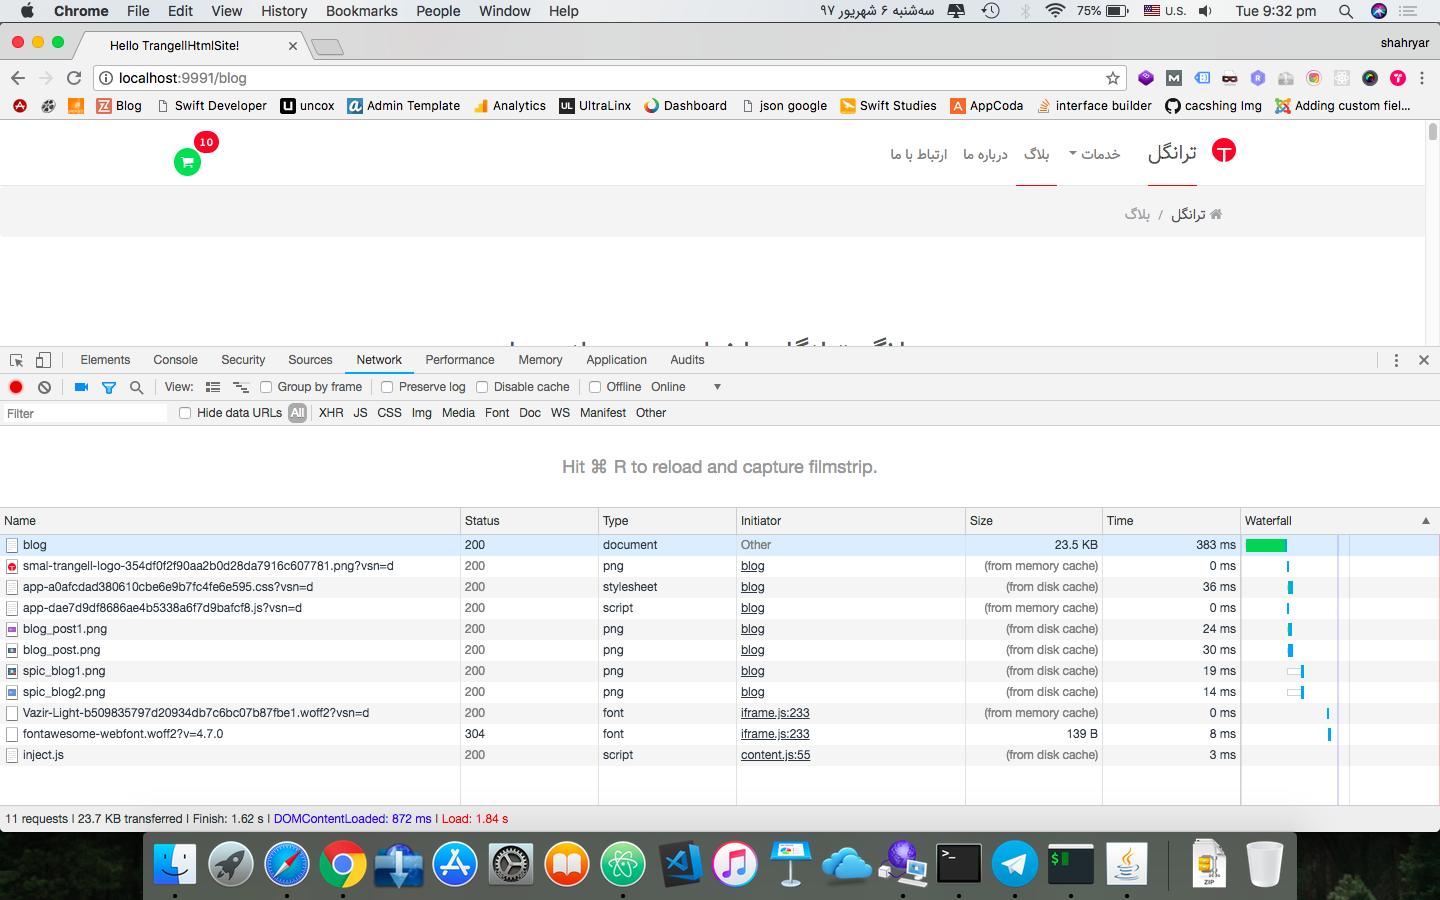
For note, if the server is running in development mode then it rescans the files on every-single-request before it ever hits your request stack and that will also inflate the times unless you turn off the reloading functionality, that will hit every OS, but that is one of the big features of development mode, but as always you never Ever Ever test speed of any product at all in development mode anyway so I would hope that is not what is being done.
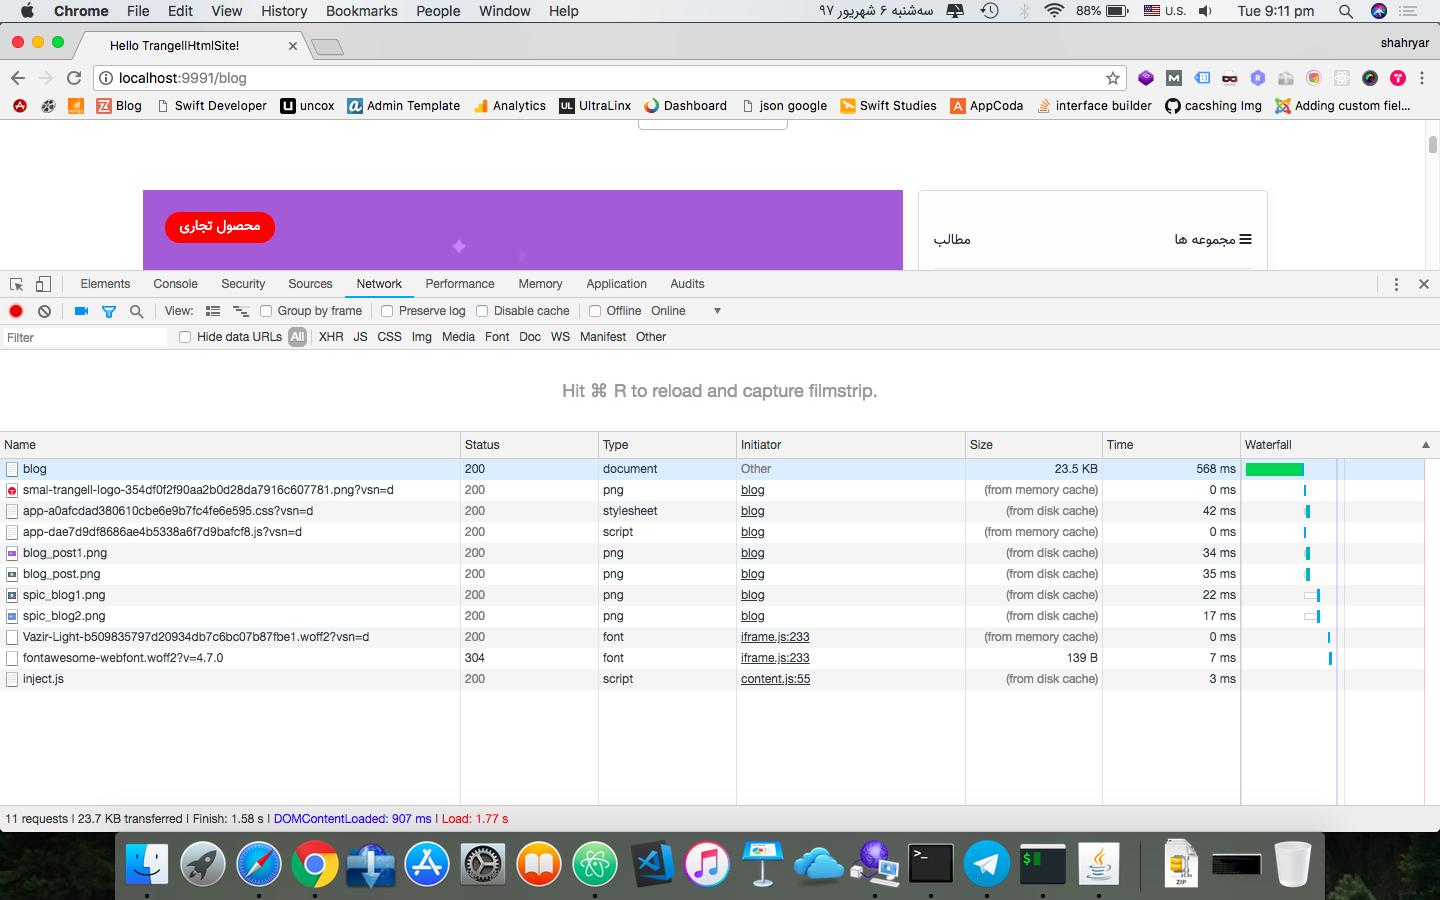
In some other threads @shahryarjb posted recently, I discovered screenshots that look suspiciously like MacOS.
So its probably not the bad implemented windows network stack, but there are still a lot of other things possible like virus scanners, reverse-proxies, docker, live-reload scanning (especially when we are in polling-mode rather than using filesystem events).
For the same of experimenting, it is just setting MIX_ENV=prod when building and starting the application. You might need to make changes in config/prod.exs then, to make it work.
To do so, you have to leave phoenix and enter the world of JavaScript, HTML and CSS. The overall pageload time includes, parsing, applying and executing those, to create the final DOM and render it into the visual representation you see in your browser. And only this visual representation has been drawn (in the visible area) in its initial state, only then this time is measured.
Also, this time is massively affected by the clients device, when you have managed to get this time sub-second, then on other computers it might still take 5 or more, depending on their RAM and CPU, or even their browser.
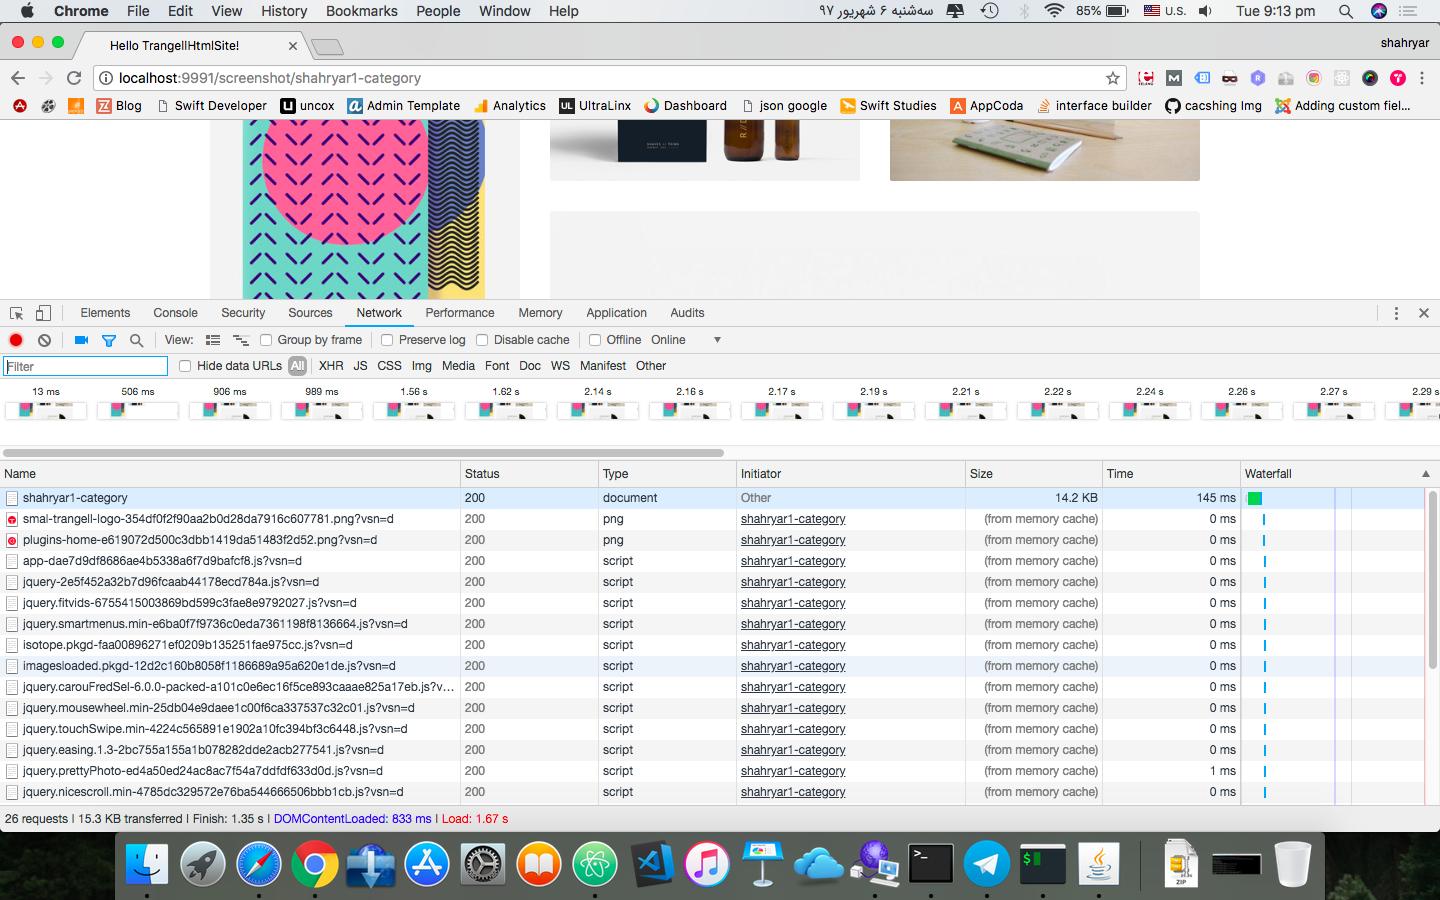
Try to not put any limits on you regarding this number, just try to not increase it much further. Also walk through your JS dependencies and re-evaluate if you really need them or if you can replace them by a more lightweight variant (especially jQuery has some that claim to be more lightweight but still compatible) or try to remove them at all (especially jQuery is a candidate that most JS folks I have talked to recently try to get rid of).