
OldhamMade
Are there any env vars I can set to reduce memory used by the VM?
I’m hosting a project on a Heroku hobby instance, and I’m starting to get warnings about exceeding the memory quota on the dyno. Thing is, the spikes I’m seeing seem quite random; the average load on the dyno at the time isn’t any higher than at other times, the service isn’t seeing a spike in requests, and the memory spikes don’t coincide with dyno restarts.
Are there any env vars I can set for the BEAM that can help to keep memory usage down on machines with limited RAM/swap space?
I’d like to avoid moving up to the next dyno level if possible. $7/m isn’t too much of an out-of-pocket expense for a project that doesn’t make any money, but the next level is $25/m… that’s a bit too costly!
Marked As Solved
OldhamMade
So, quick follow-up to this thread. It looks like ERL_COMPILER_OPTIONS='native' was the culprit. I’ve had 0 issues since rebuilding without that flag, I’ve hit the lower memory quota only twice since (during automated restarts) and haven’t hit the higher quota, and throughput is steady, topping out at ~69reqs/s.

I’ve not needed to set ERL_FULLSWEEP_AFTER=0, but it’s good to have it “in the bag” for future issues.
Next steps are to move from elixir 1.8 to 1.9 using a “real” release (current deploy is naively using mix phx.server because I’m lazy and this is a side-project) and from OTP 21 to 22 (which has only this week become available on Heroku).
Also Liked
OldhamMade
Thought a picture might help (and could be interesting for readers ![]() ):
):
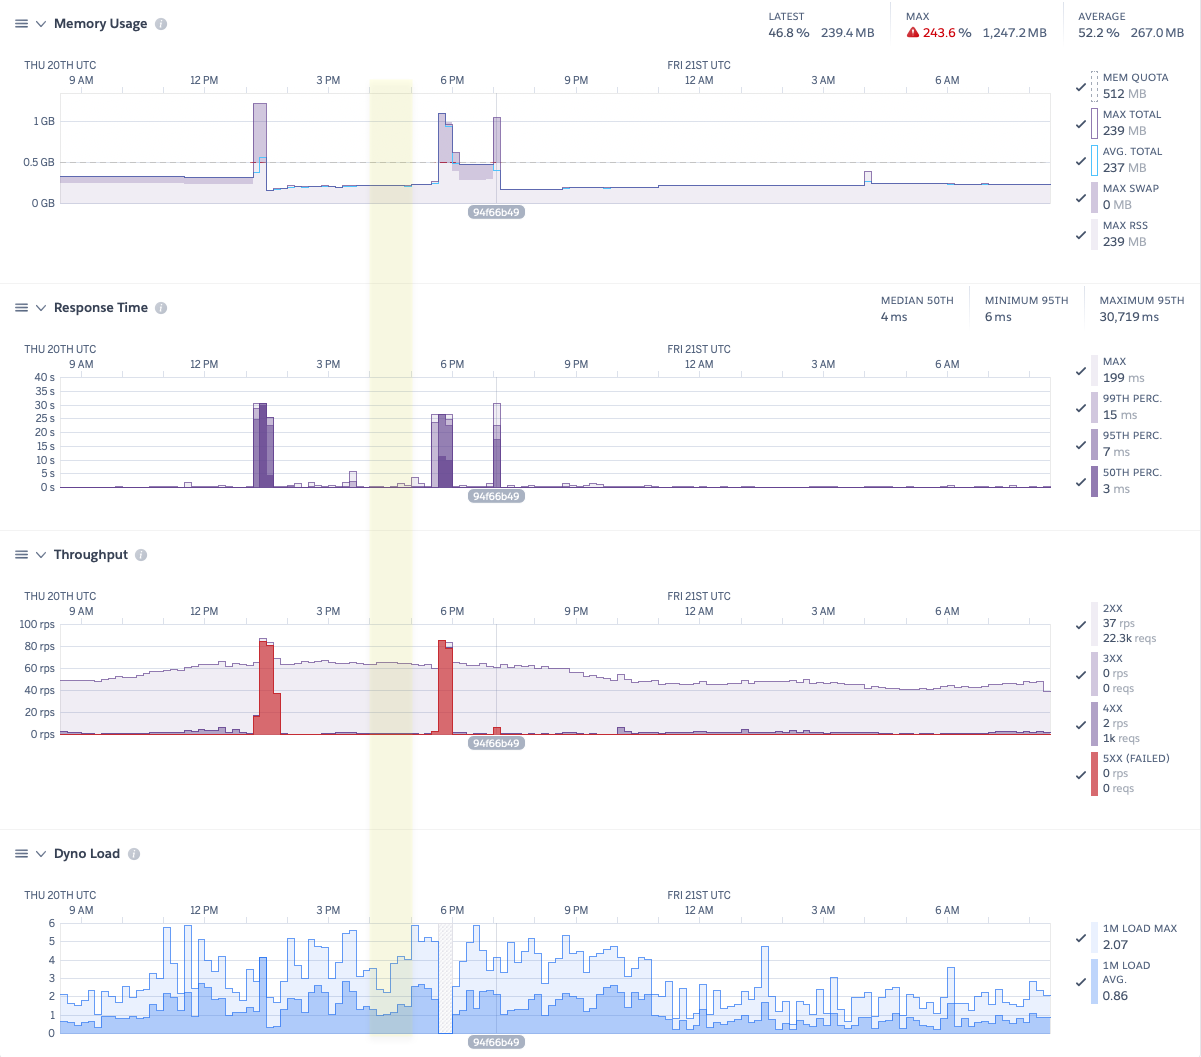
The yellow box is where the nightly quantum job happens. The label underneath each graph is the point of deployment of the new build without the ERL_COMPILER_OPTIONS='native' env var set. As you can see, since this deploy the load-arg has been lower than previous. Thoughput is down, but it tends to roll in waves, so another 5hrs should see it peak again. I’m looking forward to seeing whether there’s another memory incident with the flag disabled.

michalmuskala
Unfortunately there are no magic env vars like that. From your description, though, it seems to me like maybe you have an endpoint that is very memory-hungry. My usual suspects to look for would be loading a lot of data from the database with something like Repo.all on a huge table.
outlog
there is the fullsweep_after or ERL_FULLSWEEP_AFTER erlang — OTP 29.0.2 (erts 17.0.2) (can’t deep link for some reason..)
But I would be very careful using that, to the level of warning against using that.. it’s treating the symptoms rather than the problem.. (and can create a whole lot of other problems.. increased cpu/latency - unpredictable latency etc etc)
what is the nature of your system? do you have periodic cron/quantum jobs that does the spike.. is it one user that have obscene amount of data etc etc.
so identify what process/code is responsible for the spike..
Popular in Questions


Other popular topics


Latest on Elixir Forum
Sponsor Spotlight

Enabling companies to succeed by building software people love.
Categories:
Sub Categories:
Forums
Popular Tags
- #ecto
- #liveview
- #troubleshooting
- #learning-elixir
- #deployment
- #library
- #erlang
- #testing
- #genserver
- #mix
- #absinthe
- #remote-other
- #otp
- #plug
- #how-to-question
- #macros
- #postgres
- #channels
- #elixirconf
- #exunit
- #discussion
- #code-sync
- #javascript
- #podcasts
- #onsite
- #dialyzer
- #docker
- #authentication
- #umbrella
- #full-time-contract
- #podcasts-by-brainlid
- #ecto-query
- #elixir-ls
- #phoenix_html
- #iex
- #blog-post
- #graphql
- #genstage
- #ai
- #websockets
- #supervisor
- #advent-of-code
- #elixirconf-us
- #distillery
- #processes
- #forms
- #api
- #metaprogramming
- #security
- #performance
Our Sponsors

Build Elixir applications with speed and confidence.

Supporting innovation across the BEAM ecosystem.

We build reliable cloud platforms for business-critical systems.

Catch errors, track performance, monitor hosts and more.

Error tracking for Elixir devs who love to ship. Start your free account.

Practical resources that improve the lives of professional developers.

Producing high quality Elixir screencasts since 2017.
Enabling companies to succeed by building software people love.

The team behind Membrane, Popcorn, LiveDebugger. Available for hire.

Courses that'll move you from confusion to "Aha, now I get it!"