
mgwidmann
Debugging stuck zombie process
I have a Phoenix LiveView application which is using a fork of WebSockex (branch is here) to listen on a websocket for data incoming and then display it on the page. My listener process occasionally becomes a zombie and does not perform any work when running in production, code located here.
Looking at the phoenix live dashboard, I was able to easily find the process which oddly always pointed at being on this line (not really sure what happened since it cannot block on this line, must have been another nearby line). The process would never change to a different line, yet reductions went up slowly (like a 3-5 every 10 seconds or so).
I should be seeing a pubsub broadcast come out of the listener every second, but the external system which broadcasts to me does so several hundred times a second (so the websocket handler should always be busy). The data I broadcast every second is a digested form of the data it receives from the websocket which is not dropped. When debugging with :dbg, :erlang.trace and :erlang.trace_pattern, I see nothing on my remote shell nor in the logs (code is deployed on fly.io, so watching there for logs in case output got redirected).
Here are some examples I tried:
iex(kart_vids@ea667b9f)18> :dbg.start()
{:ok, #PID<0.10051.0>}
iex(kart_vids@ea667b9f)19> :dbg.tracer()
{:ok, #PID<0.10051.0>}
iex(kart_vids@ea667b9f)20> :dbg.tp(WebSockex, :websocket_loop, [])
{:ok, [{:matched, :kart_vids@ea667b9f, 0}]}
iex(kart_vids@ea667b9f)21> :dbg.p(:all, :c)
{:ok, [{:matched, :kart_vids@ea667b9f, 394}]}
iex(kart_vids@ea667b9f)22> :dbg.p(:all, :c)
{:ok, [{:matched, :kart_vids@ea667b9f, 394}]}
iex(kart_vids@ea667b9f)23> :dbg.stop_clear()
:ok
iex(kart_vids@ea667b9f)24> :dbg.start()
{:ok, #PID<0.10071.0>}
iex(kart_vids@ea667b9f)25> :dbg.tracer()
{:ok, #PID<0.10071.0>}
iex(kart_vids@ea667b9f)26> :dbg.tp(WebSockex, :_, [])
{:ok, [{:matched, :kart_vids@ea667b9f, 20}]}
iex(kart_vids@ea667b9f)27> :dbg.p(:all, :c)
{:ok, [{:matched, :kart_vids@ea667b9f, 0}]}
And using Saša Jurić’s soul of elixir introspection code, didn’t produce results either (I modified it to allow for a variable number of seconds, which didn’t help):
iex(kart_vids@ea667b9f)7> defmodule KartVids.Utils.Debug do
...(kart_vids@ea667b9f)7>   def trace(pid, seconds \\ 1) do
...(kart_vids@ea667b9f)7>     Task.async(fn ->
...(kart_vids@ea667b9f)7>       try do
...(kart_vids@ea667b9f)7>         :erlang.trace(pid, true, [:call])
...(kart_vids@ea667b9f)7>       rescue
...(kart_vids@ea667b9f)7>         ArgumentError ->
...(kart_vids@ea667b9f)7>           []
...(kart_vids@ea667b9f)7>       else
...(kart_vids@ea667b9f)7>         _ ->
...(kart_vids@ea667b9f)7>           :erlang.trace_pattern({:_, :_, :_}, true, [:local])
...(kart_vids@ea667b9f)7>           Process.send_after(self(), :stop_trace, :timer.seconds(seconds))
...(kart_vids@ea667b9f)7>
...(kart_vids@ea667b9f)7>           fn ->
...(kart_vids@ea667b9f)7>             receive do
...(kart_vids@ea667b9f)7>               {:trace, ^pid, :call, {mod, fun, args}} -> {mod, fun, args}
...(kart_vids@ea667b9f)7>               :stop_trace -> :stop_trace
...(kart_vids@ea667b9f)7>             end
...(kart_vids@ea667b9f)7>           end
...(kart_vids@ea667b9f)7>           |> Stream.repeatedly()
...(kart_vids@ea667b9f)7>           |> Stream.take(50)
...(kart_vids@ea667b9f)7>           |> Enum.take_while(&(&1 != :stop_trace))
...(kart_vids@ea667b9f)7>       end
...(kart_vids@ea667b9f)7>     end)
...(kart_vids@ea667b9f)7>     |> Task.await(:timer.seconds(seconds + 5))
...(kart_vids@ea667b9f)7>   end
...(kart_vids@ea667b9f)7> end
{:module, KartVids.Utils.Debug,
 <<70, 79, 82, 49, 0, 0, 11, 220, 66, 69, 65, 77, 65, 116, 85, 56, 0, 0, 1, 196,
   0, 0, 0, 45, 27, 69, 108, 105, 120, 105, 114, 46, 75, 97, 114, 116, 86, 105,
   100, 115, 46, 85, 116, 105, 108, 115, 46, ...>>, {:trace, 2}}
iex(kart_vids@ea667b9f)8> calls = KartVids.Utils.Debug.trace(pid(0, 5410, 0), 30)
[]
Using :erlang.trace produces some output, but it didn’t make much sense to me (p is the pid here)…
iex(kart_vids@ea667b9f)10> :erlang.trace(p, true, [:all, {:tracer, self()}])
1
iex(kart_vids@ea667b9f)11> flush
:ok
iex(kart_vids@ea667b9f)12> flush
:ok
iex(kart_vids@ea667b9f)13> flush
{:trace_ts, #PID<0.5410.0>, :in, {WebSockex, :websocket_loop, 3}, 1,
 {1677, 811698, 300796}}
{:trace_ts, #PID<0.5410.0>, :out, {WebSockex, :websocket_loop, 3}, 1,
 {1677, 811698, 300818}}
{:trace_ts, #PID<0.5410.0>, :in, {WebSockex, :websocket_loop, 3}, 1,
 {1677, 811698, 300822}}
{:trace_ts, #PID<0.5410.0>, :out, {WebSockex, :websocket_loop, 3}, 1,
 {1677, 811698, 300824}}
{:trace_ts, #PID<0.5410.0>, :in, {WebSockex, :websocket_loop, 3}, 1,
 {1677, 811698, 301284}}
{:trace_ts, #PID<0.5410.0>, :out, {WebSockex, :websocket_loop, 3}, 1,
 {1677, 811698, 301293}}
{:trace_ts, #PID<0.5410.0>, :in, {WebSockex, :websocket_loop, 3}, 1,
 {1677, 811698, 301297}}
{:trace_ts, #PID<0.5410.0>, :out, {WebSockex, :websocket_loop, 3}, 1,
 {1677, 811698, 301299}}
{:trace_ts, #PID<0.5410.0>, :in, {WebSockex, :websocket_loop, 3}, 1,
 {1677, 811706, 381713}}
{:trace_ts, #PID<0.5410.0>, :out, {WebSockex, :websocket_loop, 3}, 1,
 {1677, 811706, 381719}}
:ok
It wasn’t until I tried sending the process a message that it got “uncloged”:
iex(kart_vids@ea667b9f)34> p
#PID<0.5410.0>
iex(kart_vids@ea667b9f)35> send(p, {:test, "MESSAGE"})
{:test, "MESSAGE"}
iex(kart_vids@ea667b9f)36> *** ERROR: Shell process terminated! (^G to start new job) ***
Looks like the entire application rebooted because it ran OOM.
2023-03-03T03:09:09.485 app[ea667b9f] iad [info] [78407.014156] Out of memory: Killed process 520 (beam.smp) total-vm:2078356kB, anon-rss:347296kB, file-rss:0kB, shmem-rss:87280kB, UID:65534 pgtables:1088kB oom_score_adj:0

2023-03-03T03:09:09.507 app[ea667b9f] iad [info] [os_mon] cpu supervisor port (cpu_sup): Erlang has closed

2023-03-03T03:09:09.507 app[ea667b9f] iad [info] [os_mon] memory supervisor port (memsup): Erlang has closed

2023-03-03T03:09:09.617 app[ea667b9f] iad [info] Starting clean up.

2023-03-03T03:09:09.621 app[ea667b9f] iad [info] Process appears to have been OOM killed!

The shell crashing was not immediate. The timeframe where memory expansion starts to go exponential at the end, about 3-5 minutes timeframe, is about how long it took. When I looked back after trying to figure out what else to do, I noticed it had crashed.
Only thing I can think of is the websocket library got stuck on receiving data since there is no after in the receive, but the Phoenix Live Dashboard had no messages in the queue and very little memory used for that process (about 40kb). But I know, and I checked, that websocket I’m listening to was broadcasting data. Any ideas what to look at? Is there a better library for getting a GenServer like experience for listening to a websocket? (should be client side, not server side)
Most Liked
mgwidmann
I’ve narrowed it down a little bit. Perhaps the process isn’t doing anything wrong, but rather theres something wrong with the port which it has opened for the websocket.
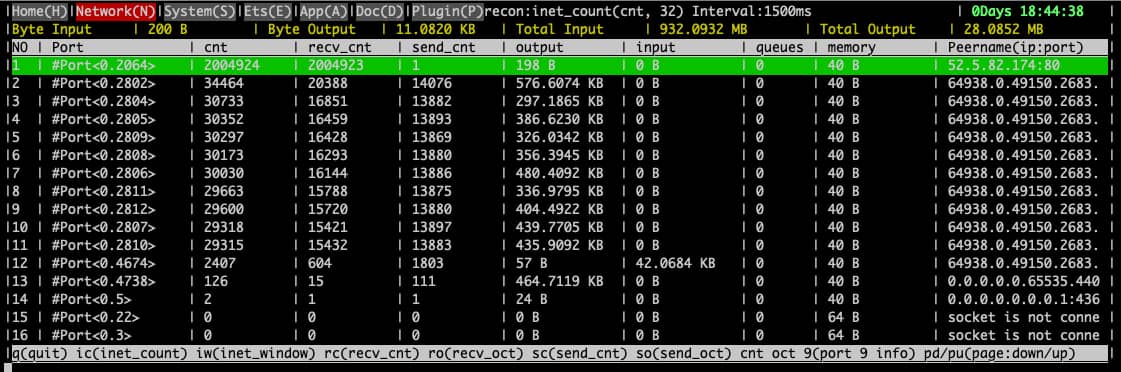
The highlighted port is the one which is linked to the process in question. Normally, when its healthy, the recv_cnt is always going up as there are over 100 broadcasts per second coming in on this websocket. But for whatever reason the count has stopped going up at all. I’m not aware of any limits this could hit but I’m going to try to modify the websocket code to put an after on the receive call so that it cannot get hung. If it does not receive anything in a certain period of time, it should disconnect and attempt to reconnect. I will see if that fixes things maybe.
Popular in Questions


Other popular topics


Latest on Elixir Forum
Sponsor Spotlight

Courses that'll move you from confusion to "Aha, now I get it!"
Categories:
Sub Categories:
Forums
Popular Tags
- #ecto
- #liveview
- #troubleshooting
- #learning-elixir
- #deployment
- #library
- #erlang
- #testing
- #genserver
- #mix
- #absinthe
- #remote-other
- #otp
- #plug
- #how-to-question
- #macros
- #postgres
- #channels
- #elixirconf
- #exunit
- #discussion
- #code-sync
- #javascript
- #podcasts
- #onsite
- #dialyzer
- #docker
- #authentication
- #umbrella
- #full-time-contract
- #podcasts-by-brainlid
- #ecto-query
- #elixir-ls
- #phoenix_html
- #iex
- #blog-post
- #graphql
- #genstage
- #ai
- #websockets
- #supervisor
- #elixirconf-us
- #advent-of-code
- #distillery
- #processes
- #api
- #forms
- #metaprogramming
- #security
- #hex
Our Sponsors

Build Elixir applications with speed and confidence.

Supporting innovation across the BEAM ecosystem.

We build reliable cloud platforms for business-critical systems.

Catch errors, track performance, monitor hosts and more.

Error tracking for Elixir devs who love to ship. Start your free account.

Practical resources that improve the lives of professional developers.

Producing high quality Elixir screencasts since 2017.

Enabling companies to succeed by building software people love.

The team behind Membrane, Popcorn, LiveDebugger. Available for hire.
Courses that'll move you from confusion to "Aha, now I get it!"