
silviurosu
Downtime of Elixir app
I have an Elixir production app deployed with Coolify on a big Hetzner server.
Most of the time the app works fine but there are a few minutes of downtime that happen almost daily (1-2 times a day only) when my app becomes unresponsive, most of the time the downtime is around 2 minutes.
The server CPU and memory never goes more than 25-30% so it’s not because of not enough resources.
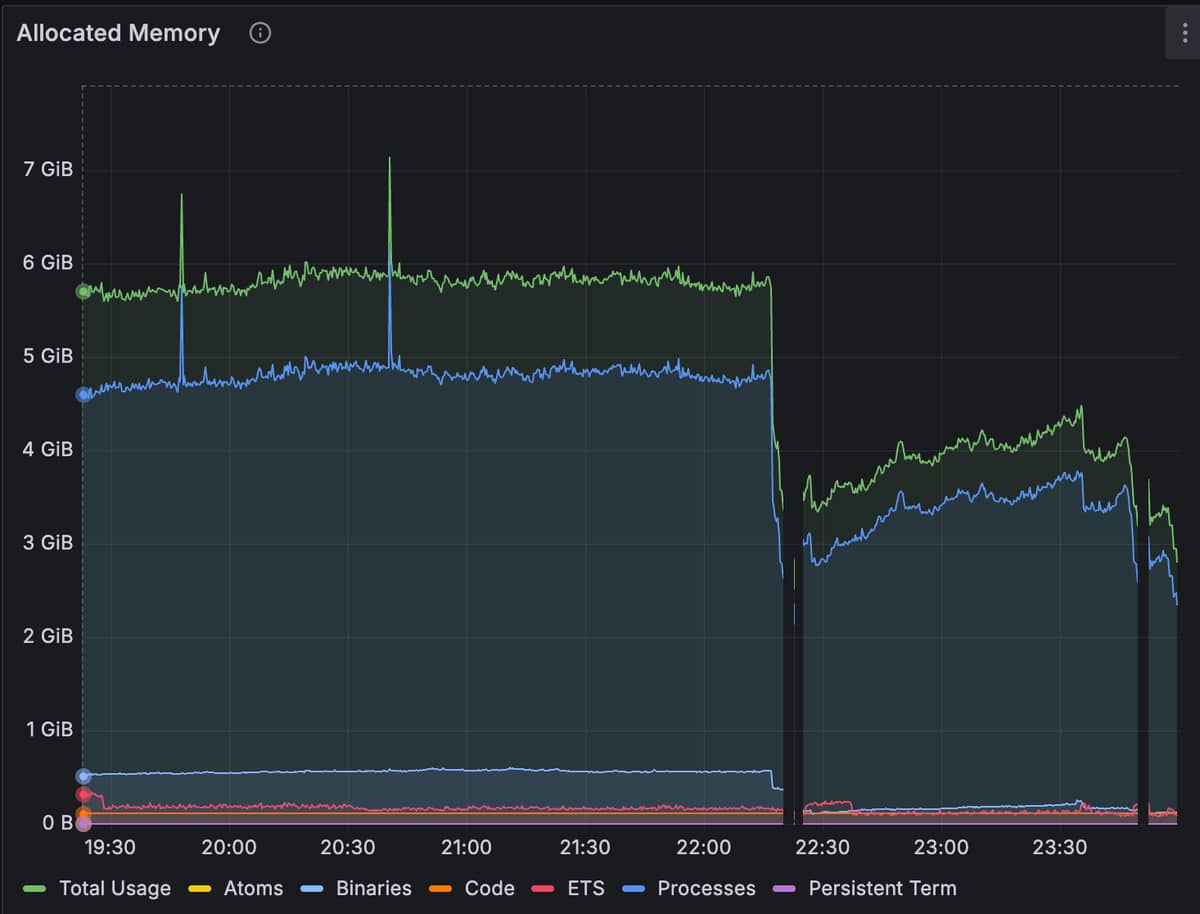
As you can see in this Grafana snapshot there are some gaps where prometheus is not able to reach the app to collect metrics.
I tried to watch for server restarts, read Coolify logs but I could not find any clue. Did you guys have any similar issue? How would you debug this further?
I would not want to switch to a cluster deployment and complicate things.
Most Liked

NobbZ
Network switch daily reboot?
If you ssh into the hosting machine or even the docker container, will that connection persist or go down? Can you trace during that time? Are other services in the same datacenter also affected?

Hermanverschooten
I had something like that a couple of years back, turned out to be backups freezing my instance.

bgr11n
You sure there was a downtime?
To be honest looks like there is no datapoints on graph for that time.
Popular in Questions


Other popular topics


Latest on Elixir Forum
Sponsor Spotlight

Enabling companies to succeed by building software people love.
Categories:
Sub Categories:
Forums
Popular Tags
- #ecto
- #liveview
- #troubleshooting
- #learning-elixir
- #deployment
- #library
- #erlang
- #testing
- #genserver
- #mix
- #absinthe
- #remote-other
- #otp
- #plug
- #how-to-question
- #macros
- #postgres
- #channels
- #elixirconf
- #exunit
- #discussion
- #code-sync
- #javascript
- #podcasts
- #onsite
- #dialyzer
- #docker
- #authentication
- #umbrella
- #full-time-contract
- #podcasts-by-brainlid
- #ecto-query
- #elixir-ls
- #phoenix_html
- #iex
- #blog-post
- #graphql
- #genstage
- #ai
- #websockets
- #supervisor
- #elixirconf-us
- #advent-of-code
- #distillery
- #processes
- #forms
- #api
- #metaprogramming
- #security
- #hex
Our Sponsors

Build Elixir applications with speed and confidence.

Supporting innovation across the BEAM ecosystem.

We build reliable cloud platforms for business-critical systems.

Catch errors, track performance, monitor hosts and more.

Error tracking for Elixir devs who love to ship. Start your free account.

Develop your skills with books, videos, and courses.
Enabling companies to succeed by building software people love.

The deployment platform built for Elixir: PaaS ease, VPS control.

The team behind Membrane, Popcorn, LiveDebugger. Available for hire.

Courses that'll move you from confusion to "Aha, now I get it!"