Ecto query often timing out when using a pin (^) next to module attribute

I have been debugging an Ecto performance issue with a slow Ecto Query against a PostgreSQL database, and I managed to narrow it down to an unnecessary pin (^) next to a constant value (module attribute). When the pin is present, the Ecto Query can often hang for many seconds or even time out. Without the pin, the query usually takes just a few milliseconds.

The query in question looks like this:

from(t in Table,
  where:
    t.tenant_id == ^user_tenant_id and
      t.context_id == ^context_id and
      t.status in ^@active_statuses,
  order_by: [desc: t.id],
  limit: 400,
  select: t.id
)

where ids are bigint IDs, status is varchar(255), @active_statuses is a list of ["open", "pending"], and there is an index on [:tenant_id, :context_id, :status]

The table is pretty big (4_000_000+ rows). A single tenant may have hundreds of thousands of rows but the vast majority of rows (probably ~95%) have status that is not one of the active ones.

To debug I ran explain on the query in production with various parameters interchangeably (but keeping all three pins, including the statuses one):

Ecto.Adapters.SQL.explain(DB.Repo, :all, query, analyze: true, verbose: true, buffers: true) |> IO.puts()

But I couldn’t reproduce the slowdowns this way, queries were using the correct index and had always the same plan. Executing the very same query immediately after with Repo.all(query) would hang for seconds.

I rewrote the Ecto query to make it a raw SQL query, copying what Ecto was generating for it, deployed to production, and it made a huge difference - all the timeouts are just gone!

query =
  "SELECT t.id FROM table as t WHERE t.tenant_id = $1 AND t.context_id = $2 AND (t.status)::text = ANY ('{open,pending}'::text[]) ORDER BY t.id DESC LIMIT 400;"

ids_result = Ecto.Adapters.SQL.query!(Repo, query, [user_tenant_id, context_id])
List.flatten(ids_result.rows)

I further investigated and managed to go back to an Ecto Query - the fix to make it fast turned out to be just changing ^@active_statuses to @active_statuses ! But explain still shows the same execution plan, no matter if we use ^ or not.

It seemed natural for us that queries against that table could be slow, but having them so slow that they were often timing out was problematic. We are aware of other optimization options like reorganizing indexes, partial indexes and partitioning, but we’d like to understand why the pin makes such a huge difference?

From Ecto documentation:

The pin operator instructs the query builder to use parameterized SQL queries protecting against SQL injection.

So the Ecto Query interface is flexible, and allows to mark constants as parameters as well - not just variables.

Another angle we looked at were prepared statements. Above raw SQL query will not use a prepared statement, so PostgreSQL will plan each execution separately. But the performance issues are gone after going back to an Ecto Query as well, just after removing the pin.

Does anyone know what might be happening here? I would appreciate any hints to further narrow down and understand this behavior.
1 Like

If you use a pin the ecto query just takes whatever value the pinned expression evaluates to at runtime and uses that value as the parameter. That’s it. It doesn’t at all care what the actual expression is.

Also module attributes are not constants. They can indeed change very much over the course of module compilation. They’re just often used in places where other languages might see constants being used.

Without the pin the query should not use a parameter for the @active_statuses, but include the value in the query itself. Therefore the queries with and without the pin should be different even if the query planer might be the same.

If the biggest difference boiled down to the query itself being different, the execution in explain with the analyze option set to true would be different as well, but it wasn’t - it was always fast even with the pin. Do you know why that could be the case?

Could it be that it’s the Postgres cache? If these are two different queries it’s cached differently than if it’s one query with different parameters? But I doubt that. It’s super puzzling.

Here is a script that may better ilustrate the issue, notice that the raw SQL query is also parametrized on status but it doesn’t hang:

import Ecto.Query

# Always fast (~2s total)

for _ <- 0..100,
  {tenant_id, context_id} <- [{a, b}, {c, d}, {e, f}, {g, h}] do
  q =
    from(t in Table,
      where:
        t.tenant_id == ^tenant_id and
          t.context_id == ^context_id and
          t.status in ["open", "pending"],
      order_by: [desc: t.id],
      limit: 400,
      select: t.id
    )
  DB.Repo.all(q)
  :ok
end

# Slightly slower but also fast (~3s total)

q = "SELECT t.id FROM table as t WHERE t.tenant_id = $1 AND t.context_id = $2 AND t.status::text = ANY ($3::text[]) ORDER BY t.id DESC LIMIT 400;"
for _ <- 0..100,
  {tenant_id, context_id} <- [{a, b}, {c, d}, {e, f}, {g, h}] do
  Ecto.Adapters.SQL.query!(DB.Repo, q, [tenant_id, context_id, ["open", "pending"]])
  :ok
end

# Hangs for seconds every few queries, then times out

for _ <- 0..100,
  {tenant_id, context_id} <- [{a, b}, {c, d}, {e, f}, {g, h}] do
  q =
    from(t in Table,
      where:
        t.tenant_id == ^tenant_id and
          t.context_id == ^context_id and
          t.status in ^["open", "pending"],
      order_by: [desc: t.id],
      limit: 400,
      select: t.id
    )
  DB.Repo.all(q)
  :ok
end

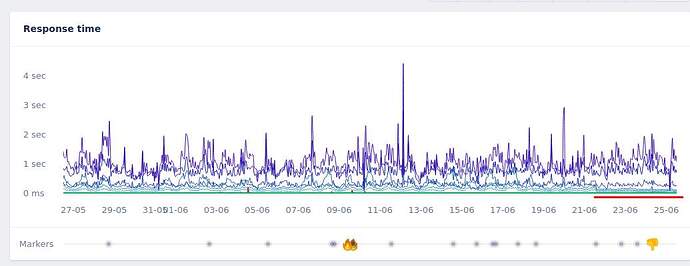
So I have been monitoring the affected system (I work with my brother @michallepicki on it) and the change to not using the pin operator has a profound overall impact on the performance.

Not only it removed the occasional timeouts of the queries, but the average response time for the web requests (green line below) improved dramatically.

I don’t understand what could have caused this but maybe even this is a bug in Ecto itself? Or, it somehow affects the performance of Postgres in negative way. It’s very strange.

@josevalim @ericmj @michalmuskala or @wojtekmach is this something we should be investigating further or this is somewhat known and expected behaviour?

1 Like

Are you able to paste the logged SQL for each type of query made? I believe setting log to debug will print it out.

I have personally seen postgres query caching do really weird and hard to reproduce things (ActiveRecord not ecto in the case I’m thinking about). Getting the raw SQL may show a difference in how the query is being made.

Can you also explain analyze each query type to show the output? It’s important that the exact query is being explained, though, because of the query cache oddities that can hide problems.

2 Likes

In order from the above script the executed SQL is:

--Fast, executed with Repo.all
SELECT t0."id" FROM "table" AS t0 WHERE (((t0."tenant_id" = $1) AND (t0."context_id" = $2)) AND t0."status" IN ('open','pending')) ORDER BY t0."id" DESC LIMIT 400 [X, X]

--Also fast, hand-crafted to be pretty much the same as third example, but executed with Ecto.Adapters.SQL.query!
SELECT t.id FROM table as t WHERE t.tenant_id = $1 AND t.context_id = $2 AND t.status::text = ANY ($3::text[]) ORDER BY t.id DESC LIMIT 400; [X, X, ["open", "pending"]]

--Slow, executed with Repo.all
SELECT t0."id" FROM "table" AS t0 WHERE (((t0."tenant_id" = $1) AND (t0."context_id" = $2)) AND t0."status" = ANY($3)) ORDER BY t0."id" DESC LIMIT 400 [2, 2, ["open", "pending"]]

The thing is, the explain analyze output is virtually the same for all cases. I think this may be because when executing a single query, PostgreSQL will take into account the bound variables (will plan this very query individually).

I found a very interesting blog post on PostgreSQL performance. My theory is that this happens only in the Ecto’s prepared statement and that’s why the slowdown doesn’t show in individual explain analyze calls. Probably after 5 “fast” (individually planned) queries, PostgreSQL (incorrectly) assumes that a generic plan will be better going forward. Possibly I would see the slowdowns if I found the prepared statement that Ecto created, and ran explain analyze on its execution, but Ecto doesn’t give an easy interface to do that from what I can tell, I’m a bit hesitant to experiment with this in production.

I also found a different (less related) blog post on Ecto and PostgreSQL performance in Pleroma, where they even decided to disable prepared statements in Ecto because of the performance differences they saw. I do not agree with their conclusion, though - I think in general, prepared statements should be used as they allow to avoid unnecessary planning overhead. In individual situations, the generic plan that PostgreSQL chooses for a prepared statement may be very inefficient for a table with values distribution like theirs, and it also can tank the performance when a programmer makes a mistake like my unecessary pin.

2 Likes

Ah yeah we run parameters: [plan_cache_mode: "force_custom_plan"] as an option on our Repos for this reason. We make use of partitioned tables, and if you don’t use a custom plan then the query plan won’t be able to select specific partitions when it moves to the generic plan.

3 Likes

I think you’re spot on with the query plan idea. Out of curiosity, do you have any partial indices on this table? In particular on the status column?

We don’t have any partial indices on that table right now, but we will explore that idea in the future if we have other performance issues