does this help: Anyone received their new MacBook Pros today? - #8 by joseph-lozano
Unfortunately it has not helped.
Using asdf to uninstall and then reinstall Erlang with the following flags exported definitely made a big difference on my MacBook Pro M1 Max.
export KERL_CONFIGURE_OPTIONS="
      --disable-debug \
      --disable-silent-rules \
      --enable-dynamic-ssl-lib \
      --enable-hipe \
      --enable-shared-zlib \
      --enable-smp-support \
      --enable-threads \
      --enable-wx \
      --with-ssl=$(brew --prefix openssl@1.1) \
      --without-javac
      --enable-darwin-64bit \
      --enable-kernel-poll \
      --with-dynamic-trace=dtrace \
     "
1 Like
Enable hipe? Isnt that project dead?
1 Like
The args were copied from the Erlang homebrew formula.
Given this one is maintained by brew bump-formula-pr is likely keeping cruft around quite well 
1 Like
I’m running almost those exact options, I have --disable-hipe instead of enable since it’s a dead project.
So here’s something that’s interesting. I did rm -rf _build and then iex -S mix run --no-start --no-compile so that I could open :observer, and then I called the Mix.Task.run("deps.compile") to look at how it performed from Erlang’s perspective.
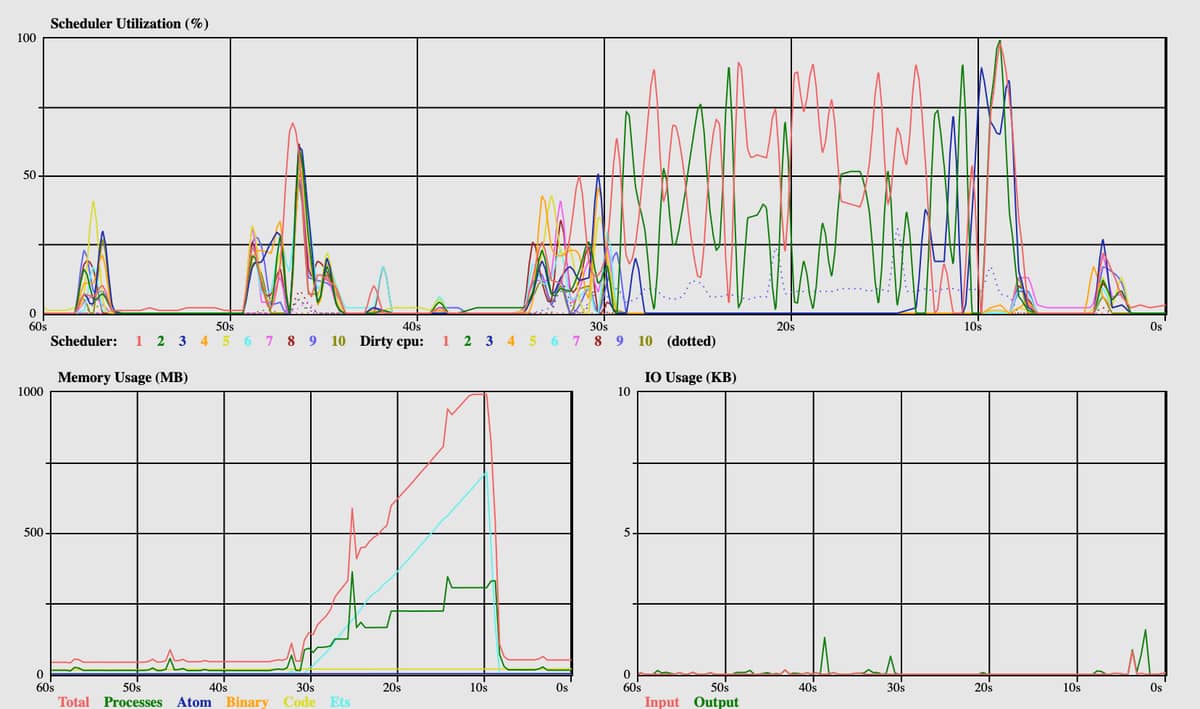
Here’s what I saw:
Initial:
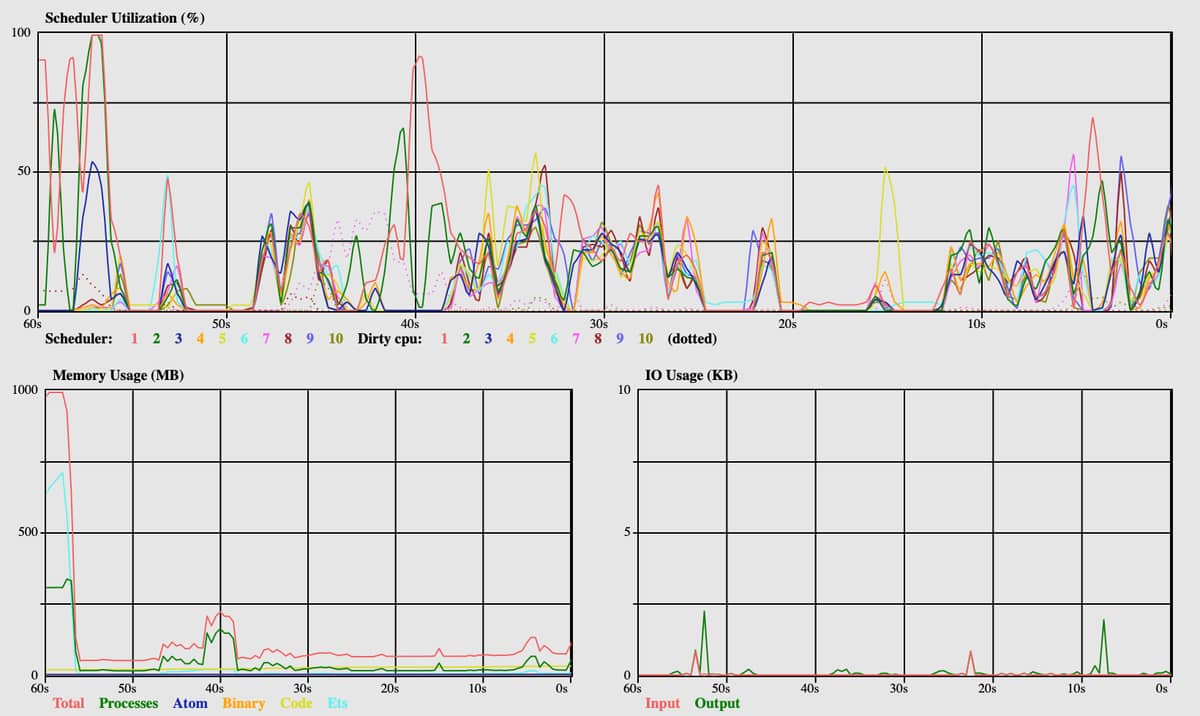
More deps:
More deps:
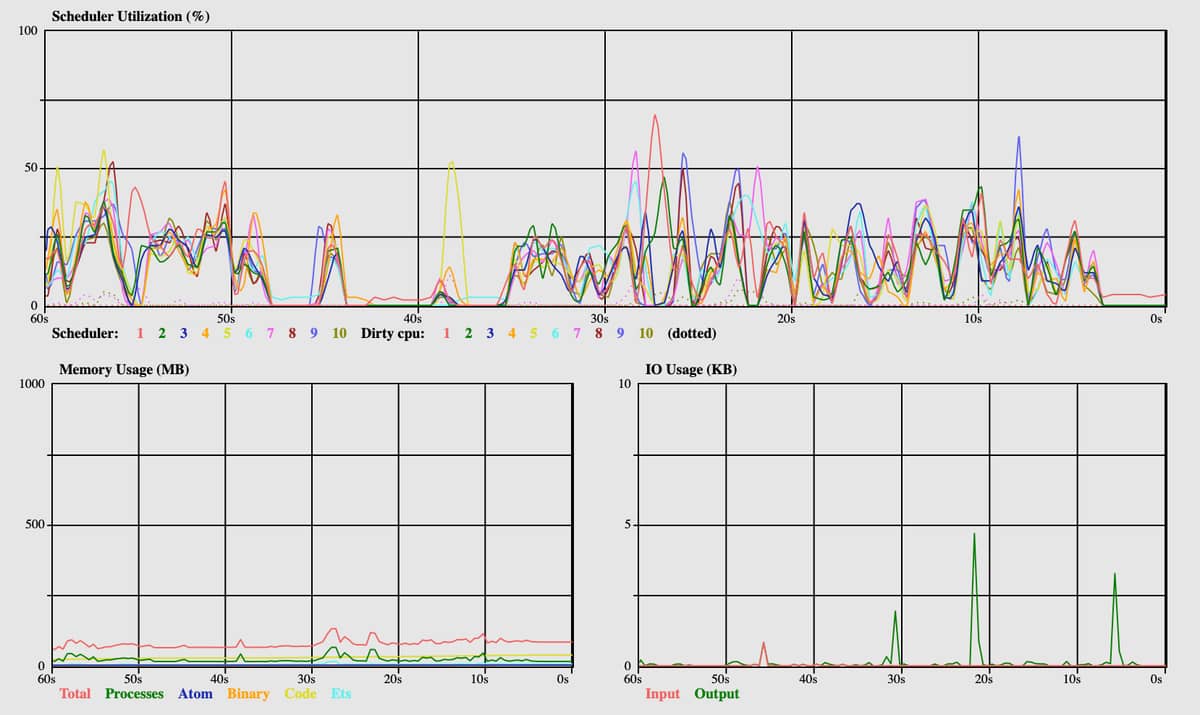
This looks super strange to me. Scheduler utilization across the board is super low. I ran compile after the deps were compiled and although it did look like all 10 schedulers got involved (as we see here with some deps) none of them ever exceeded 30%.
I’m not entirely sure what to make of this. The big memory spike was Poison (yes, I know) and I think that’s likely just code gen. Anyone got any insights?
UPDATE:
Running this code trivially uses all 10 schedulers and maxes out cores from an OS level:
iex(3)> defmodule Busy do
  ...(3)>   def loop(x) do
  ...(3)>     loop(x + 1)
  ...(3)>   end
  ...(3)> end
  iex(4)> 1..20 |> Enum.map(fn _ -> spawn(fn -> Busy.loop(0) end)
So maybe the OS is right. Compilation (for some reason) is generally not generating very much scheduler activity (for some reason) and so it can run everything on the efficiency cores. When the schedulers are under load it does seem to happily move them to the performance cores.
5 Likes
IO bound then?
Very unlikely that compilation is that IO bound. He is using about 5% of the processing power. Maybe if sth is wrong with the storage.
After a chat with @dch on IRC we’re noticing that :erlang.system_info :cpu_topology returns :undefined which may be part of the issue. Will update with followup.
7 Likes
Interesting think is that on my MacBook with Intel it also returns :undefined.
The cpu_topology only affects how schedulers are bound. So you have to pass the +sbt option to Erlang in order for it to change anything. If I recall correctly it will return undefined on all MacOS devices because Apple does not provide (or we at least do not fetch) information about what the CPU topology looks like.
3 Likes
It seems that OSX (on both intel, which I have here, and M1, which I don’t) doesn’t provide any topology information, so we get undefined everywhere. For comparison, an 8 core non-SMT intel box (single socket):
 erl -noshell -eval 'io:format("~p~n",[erlang:system_info(cpu_topology)])' -s erlang halt
[{processor,[{core,{logical,0}},
             {core,{logical,1}},
             {core,{logical,2}},
             {core,{logical,3}},
             {core,{logical,4}},
             {core,{logical,5}},
             {core,{logical,6}},
             {core,{logical,7}}]}]
And an 80-core arm64 box with partitioning (single socket, but NUMA):
[{processor,[{core,{logical,0}},
             {core,{logical,1}},
             {core,{logical,2}},
              ...
             {core,{logical,39}}]},
 {processor,[{core,{logical,40}},
             {core,{logical,41}},
             {core,{logical,42}},
             ...
             {core,{logical,79}}]}]
It would be great to see if the OTP team could advise how to (ab)use the cores best here on M1, given that the efficiency cores run ~ 1/3 slower clock speed. It would be great to pin the schedulers, but I guess that requires Apple to provide information on how to access it.
The usual FreeBSD sysctls that expose that seem to be missing on OSX.
1 Like
More M1 fun: Hardware Information - by Jim Cownie - CPU fun is the best resource I found… in particular brew install hwloc and running lstopo. neat!
Setting up the Apple M1 for Code Development is also excellent.
2 Likes
[hwloc-announce] hwloc 2.6.0 released it seems the latest release is able to extract CPU info from M1
Version 2.6.0
-------------
* Backends
  + Expose two cpukinds for energy-efficient cores (icestorm) and
    high-performance cores (firestorm) on Apple M1 on Mac OS X.
Maybe that helps!
1 Like
Linking this back to OTP itself, configure looks for a number of platform-specific cpu pinning options, and sets HAVE_CPUSET_xETAFFINITY during configure using some configure.ac checks. This requires the sys.cpuset.h headers.
On OSX, this simply isn’t here. Skimming Apple’s docs, I the closest I could find is here Affinity API Release Notes for OS X v10.5 which is pretty old now, but suggests we don’t have that functionality at all, certainly at least back in Snow Leopard days.
I dug around on OSX and found /Library/Developer/CommandLineTools/SDKs/MacOSX.sdk/usr/include/mach/thread_policy.h & found this gem, which appears to be as close as we can get.
/*
 * THREAD_AFFINITY_POLICY:
 *
 * This policy is experimental.
 * This may be used to express affinity relationships
 * between threads in the task. Threads with the same affinity tag will
 * be scheduled to share an L2 cache if possible. That is, affinity tags
 * are a hint to the scheduler for thread placement.
 *
 * The namespace of affinity tags is generally local to one task. However,
 * a child task created after the assignment of affinity tags by its parent
 * will share that namespace. In particular, a family of forked processes
 * may be created with a shared affinity namespace.
 *
 * Parameters:
 * tag: The affinity set identifier.
 */
On FreeBSD, which supports scheduler binding, the configure script shows:
checking for sched_getaffinity/sched_setaffinity... no
checking for pset functionality... no
checking for processor_bind functionality... no
checking for cpuset_getaffinity/cpuset_setaffinity... yes
vs @benwilson512 's OSX M1:
checking for sched_getaffinity/sched_setaffinity... no
checking for pset functionality... no
checking for processor_bind functionality... no
checking for cpuset_getaffinity/cpuset_setaffinity... no
2 Likes
Sorry to revive this old thread, but I just got an M1 Pro and I’m seeing drastically slow compile times compared to my m1 air.
Has anyone put together a reproducible fix for this issue? I don’t think I can use this computer as is. It’s taking well over 20 minutes to compile a project.
Can you check if the binaries are running in emulation mode. I migrated from Intel Mac to M1 Mac to M1 Pro -As I did not reinstall home brew and it was installing and running binaries in emulation mode.
1 Like
Looks like the beam.smp processes are running as “Kind=Apple”. Does that mean they’re in native mode?
Edit: This appears fixed and noted at bottom
I checked out several different approaches and as best as I can deduce, these are not running through Rosetta. I queried the list of Rosetta-running PIDs and it does not change during a compile phase.
The difference between my M1 air and M1 pro is stark:
pro: mix compile  85.75s user 37.34s system 33% cpu 6:11.19 total

air: mix compile  138.04s user 40.22s system 224% cpu 1:19.29 total
The CPU % on the pro makes it seem like it’s not CPU bound. Some of the bug reports I’ve seen seem to indicate it could be I/O related.
Edit: It was definitely I/O bound. I noticed that some processes finished and CPU went down a bit. Once I ran the timed compile, it finished in 1:17 compared to 6:11 previously. I’m guessing there was some indexing process from when the computer was setting itself up.
1 Like


