
henriquesati
Grafana dashboards provide ''NO DATA'' inside container network
I’m running Grafana and Prometheus with PromEx and ,although everything is connecting, the dashboards are not providing any data.
First, my dashboards are being correctly uploadeds to Grafana
[info] PromEx.LifecycleAnnotator successfully created start annotation in Grafana.
[info] PromEx.DashboardUploader successfully uploaded /app/_build/dev/lib/prom_ex/priv/application.json.eex to Grafana.
[info] Running TestespayWeb.Endpoint with Bandit 1.6.1 at 0.0.0.0:4000 (http)
[info] Access TestespayWeb.Endpoint at http://localhost:4000
[debug] hioo
[watch] build finished, watching for changes...
[info] PromEx.DashboardUploader successfully uploaded /app/_build/dev/lib/prom_ex/priv/beam.json.eex to Grafana.
[info] PromEx.DashboardUploader successfully uploaded /app/_build/dev/lib/prom_ex/priv/phoenix.json.eex to Grafana.
[info] PromEx.DashboardUploader successfully uploaded /app/_build/dev/lib/prom_ex/priv/ecto.json.eex to Grafana.
and Prometheus is correcly scraping my
both containers are inside the same network “elixir_network”
  grafana:
    image: grafana/grafana
    container_name: grafana
    ports:
      - "3000:3000"
    volumes:
      - grafana_data:/var/lib/grafana
    environment:
      - GF_SECURITY_ADMIN_USER=admin
      - GF_SECURITY_ADMIN_PASSWORD=xxx
    networks:
      - elixir_network
    restart: unless-stopped
  prometheus:
    image: prom/prometheus
    container_name: prometheus
    networks:
      - elixir_network
    volumes:
      - ./prometheus/prometheus.yml:/etc/prometheus/prometheus.yml
    ports:
      - "9090:9090"
    restart: unless-stopped
and my network is corretly working, bcs this prometheys.yaml provides the scraping
global:
scrape_interval: 15s # By default, scrape targets every 15 seconds.
scrape_configs:
  - job_name: 'prometheus'
    static_configs:
      - targets: ['localhost:9090']

  - job_name: 'phoenix_app'
    scrape_interval: 5s  # Override the global interval for this job
    static_configs:
      - targets: ['elixir_app:4000']
I have the following promex file
defmodule Testespay.PromEx do
use PromEx, otp_app: :testespay
alias PromEx.Plugins
@impl true
def plugins do
[
# PromEx built in plugins
Plugins.Application,
Plugins.Beam,
{Plugins.Phoenix, router: TestespayWeb.Router, endpoint: TestespayWeb.Endpoint},
# Plugins.Ecto,
# Plugins.Oban,
# Plugins.PhoenixLiveView,
# Plugins.Absinthe,
# Plugins.Broadway,
  # Add your own PromEx metrics plugins
  # Testespay.Users.PromExPlugin
]
end
@impl true
def dashboard_assigns do
[
datasource_id: “prom1”,
default_selected_interval: “30s”
]
end
  @impl true
  def dashboards do
    [
      # PromEx built in Grafana dashboards
      {:prom_ex, "application.json"},
      {:prom_ex, "beam.json"},
      {:prom_ex, "phoenix.json"},
      {:prom_ex, "ecto.json"},
      # {:prom_ex, "oban.json"},
      # {:prom_ex, "phoenix_live_view.json"},
      # {:prom_ex, "absinthe.json"},
      # {:prom_ex, "broadway.json"},

      # Add your dashboard definitions here with the format: {:otp_app, "path_in_priv"}
      # {:testespay, "/grafana_dashboards/user_metrics.json"}
    ]
  end
end
I’m also being able to connect my Granana to prometheus using the following URL
connection
http://prometheus:9090
that provides the ouput:
Successfully queried the Prometheus API.

Next, you can start to visualize data by [building a dashboard](http://localhost:3000/dashboard/new-with-ds/aeijentwkye4ga), or by querying data in the [Explore view](http://localhost:3000/explore?left=%7B%22datasource%22:%22prometheus%22,%22context%22:%22explore%22%7D).
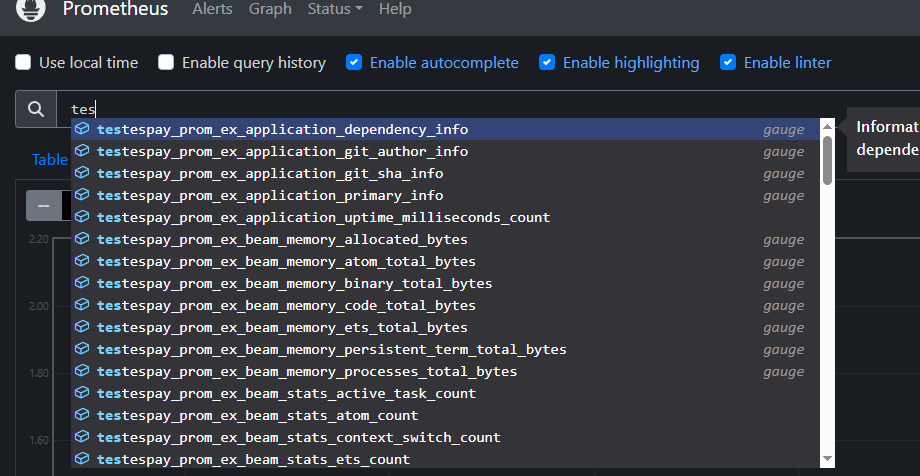
I also can query random prometheus metrics using the Grafana dashboards
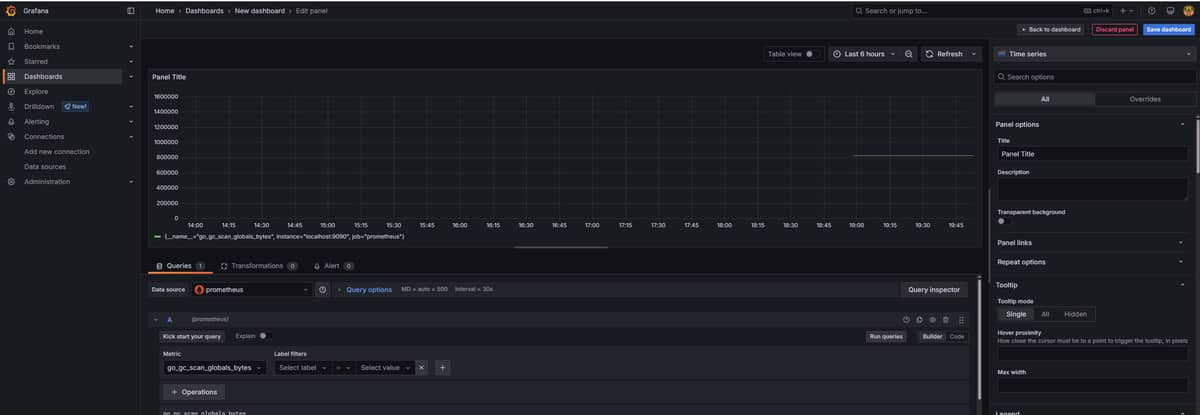
Any tips of what I must troubleshoot? I have none experience with Observality, and was hoping to have a default implementation while I learn
Marked As Solved
henriquesati
Found out that the problem was: I was providing the wrong data_source_id inside prom_ex.ex file
  def dashboard_assigns do
    [
      datasource_id: "prometheus",
      default_selected_interval: "30s"
    ]
  end
Popular in Questions


Other popular topics


Latest on Elixir Forum
Sponsor Spotlight

Build Elixir applications with speed and confidence.
Categories:
Sub Categories:
Forums
Popular Tags
- #ecto
- #liveview
- #troubleshooting
- #learning-elixir
- #deployment
- #library
- #erlang
- #testing
- #genserver
- #mix
- #absinthe
- #remote-other
- #otp
- #plug
- #how-to-question
- #macros
- #postgres
- #channels
- #elixirconf
- #exunit
- #discussion
- #code-sync
- #javascript
- #podcasts
- #onsite
- #dialyzer
- #docker
- #authentication
- #umbrella
- #full-time-contract
- #podcasts-by-brainlid
- #ecto-query
- #elixir-ls
- #phoenix_html
- #iex
- #blog-post
- #graphql
- #genstage
- #ai
- #websockets
- #supervisor
- #elixirconf-us
- #advent-of-code
- #distillery
- #processes
- #forms
- #api
- #metaprogramming
- #security
- #hex
Our Sponsors
Build Elixir applications with speed and confidence.

Supporting innovation across the BEAM ecosystem.

We build reliable cloud platforms for business-critical systems.

Catch errors, track performance, monitor hosts and more.

Error tracking for Elixir devs who love to ship. Start your free account.

Practical resources that improve the lives of professional developers.

Enabling companies to succeed by building software people love.

The deployment platform built for Elixir: PaaS ease, VPS control.

The team behind Membrane, Popcorn, LiveDebugger. Available for hire.

Courses that'll move you from confusion to "Aha, now I get it!"