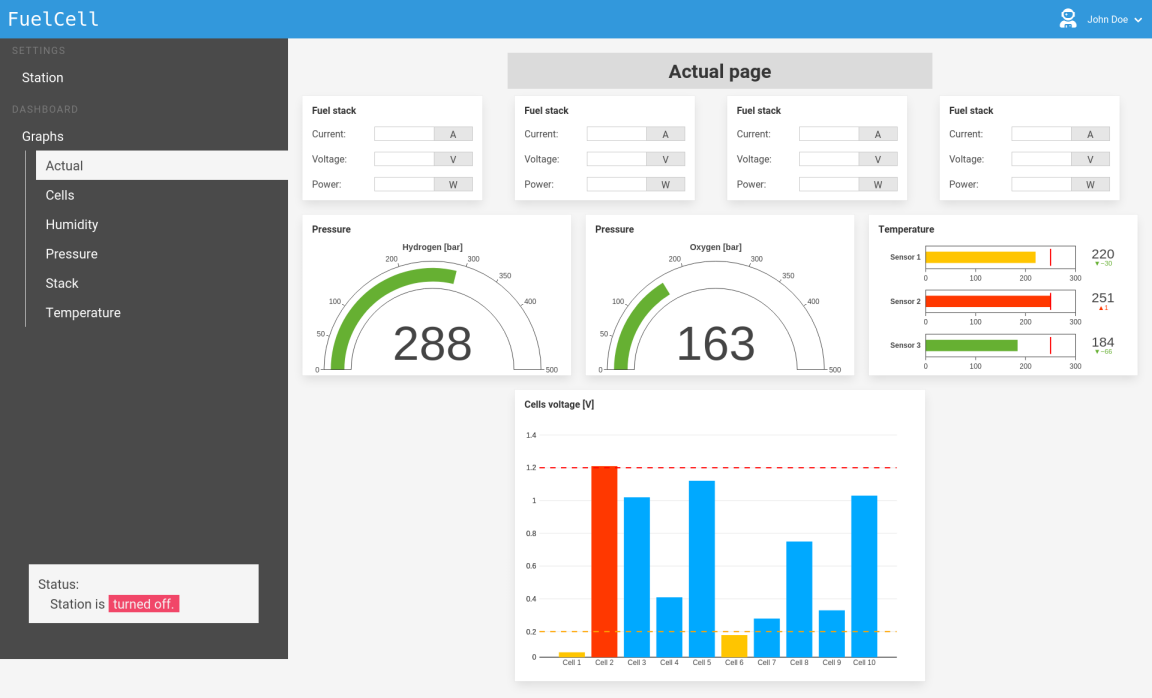
I would like to get some help / guidance on how to build more complex web dashboard something similar to “dashboards” in Grafana. So, for instance, having 1 page (dashboard) with multiple > 20 graphs of different types, like single stats, pie chars, bar chars, etc, etc.
The dilema / questions that I have are related to my newbie approach and understanding. So for instance.
You have various sources of data, pub/sub, remore REST calls, timeseries databases, Ecto (Postgres), etc, etc.
Now in Phoenix router you usually define something like “/somepath, someController, some action”
So lets assume that /somepath could be /dash1, some controller can be dash1_controller.ex, and some action… here I get to a problem. Should and how… it doesn’t seems right to me… but should I get (how) all data for > 20 graphs from various sources and prepare them under 1 controller function/action?
That would mean enormous / huge data structure passing it at once? over the view to a template and then there decompose the data structure to various graphs that would need it? or what?
And I didn’t even mention Channels configuration/setup.
I find really hard to understand this, since all the examples and tutorials are showing more or less just something simple like bar chart with 2 metrics, and one controller, one route… but this is usually far from real life example/situation.
And I assume that having good structure and approach on a project base / file base level is crucial for bigger projects and its maintability.
So , I would really appreciate some guidance, suggestions here.
Thanks in advance.