Dear All,
recently I have come across a weird phenomenon - I have spawned a bunch of GenServers, each of which was periodically performing some computation. During the computation a large enumerable had been created, however, it wasn’t saved anywhere - I assume, that such an enumerable could easily be garbage collected.
A bag of processes was using a tremendous amount of memory, increasing with every passing second. What is worse, the garbage collector didn’t seem to be invoked, even when memory usage was almost exceeding the amount available on my device. A few times have I finished with SIGBUS interrupt being thrown or the node’s process has been killed by the host OS.
I have started digging into the problem and created a minimalistic program that triggers the phenomenon occurrence - below I attach its code:
defmodule Server do
 use GenServer
 @length_of_enumerable 100_000 # length of the enumerable created in the computation
 @slacktime 1 # defines the break between the computations [ms]
 @between_gc_time 30_000 # defines the break between garbage collections invocation [ms]

 @impl true
 def init(_opts) do
  computation = fn -> Enum.map(1..@length_of_enumerable, fn _ -> 1 end) end
  send(self(), :work)
  Process.send_after(self(), :clear, @between_gc_time)
  {:ok, %{computation: computation}}
 end

 @impl true
 def handle_info(:work, state) do
  state.computation.()
  Process.send_after(self(), :work, @slacktime)
  {:noreply, state}
 end

 @impl true
 def handle_info(:clear, state) do
  :erlang.garbage_collect()
  Process.send_after(self(), :clear, @between_gc_time)
  {:noreply, state}
 end
end

:observer.start()
how_many_processes = 1000
processes =
 Enum.map(
  1..how_many_processes,
  fn _n ->
   {:ok, pid} = GenServer.start_link(Server, nil)
   pid
  end
 )

Process.sleep(200_000)
Enum.each(processes, &Process.exit(&1, :kill))
That program allowed me to reproduce the behavior, furthermore, I have found out some other things:
- when the number of GenServers is small enough or the enumerable is not that big, the memory usage seems to stabilize at some (more or less tremendous) level
- the pace at which the memory usage was increasing was greater when the time between computation invocations was shorter
After invoking a garbage collector with :erlang.garbage_collect() on which of the GenServers, the memory was indeed freed.
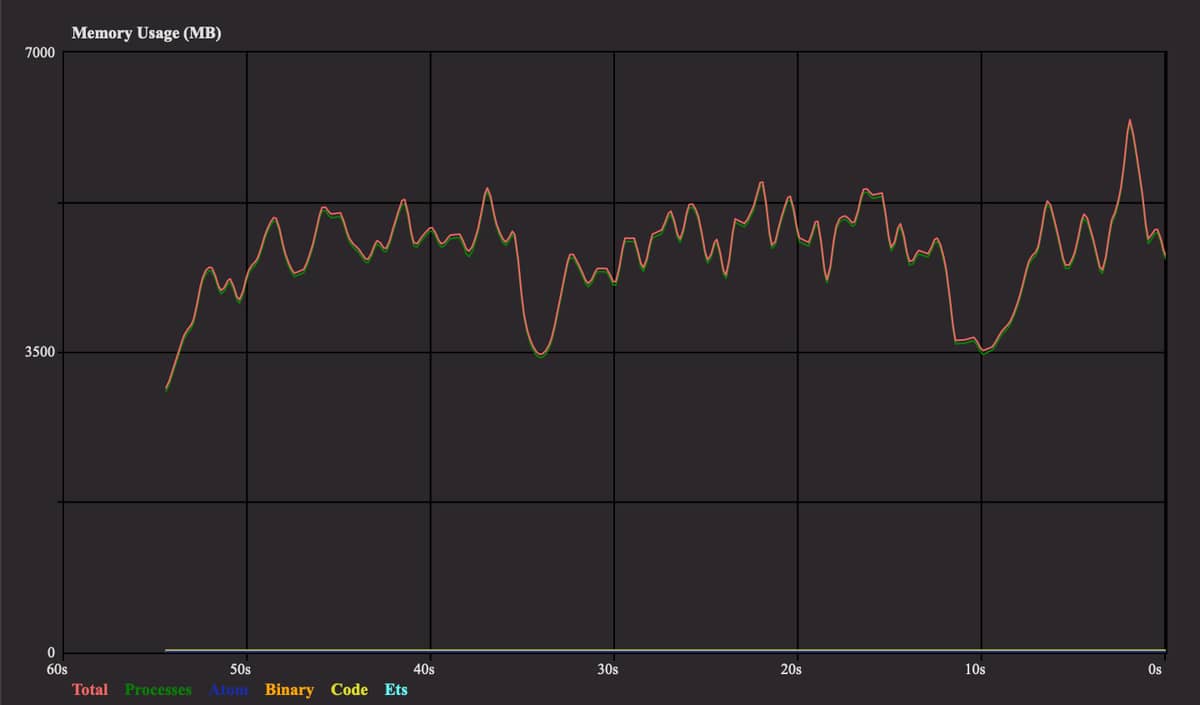
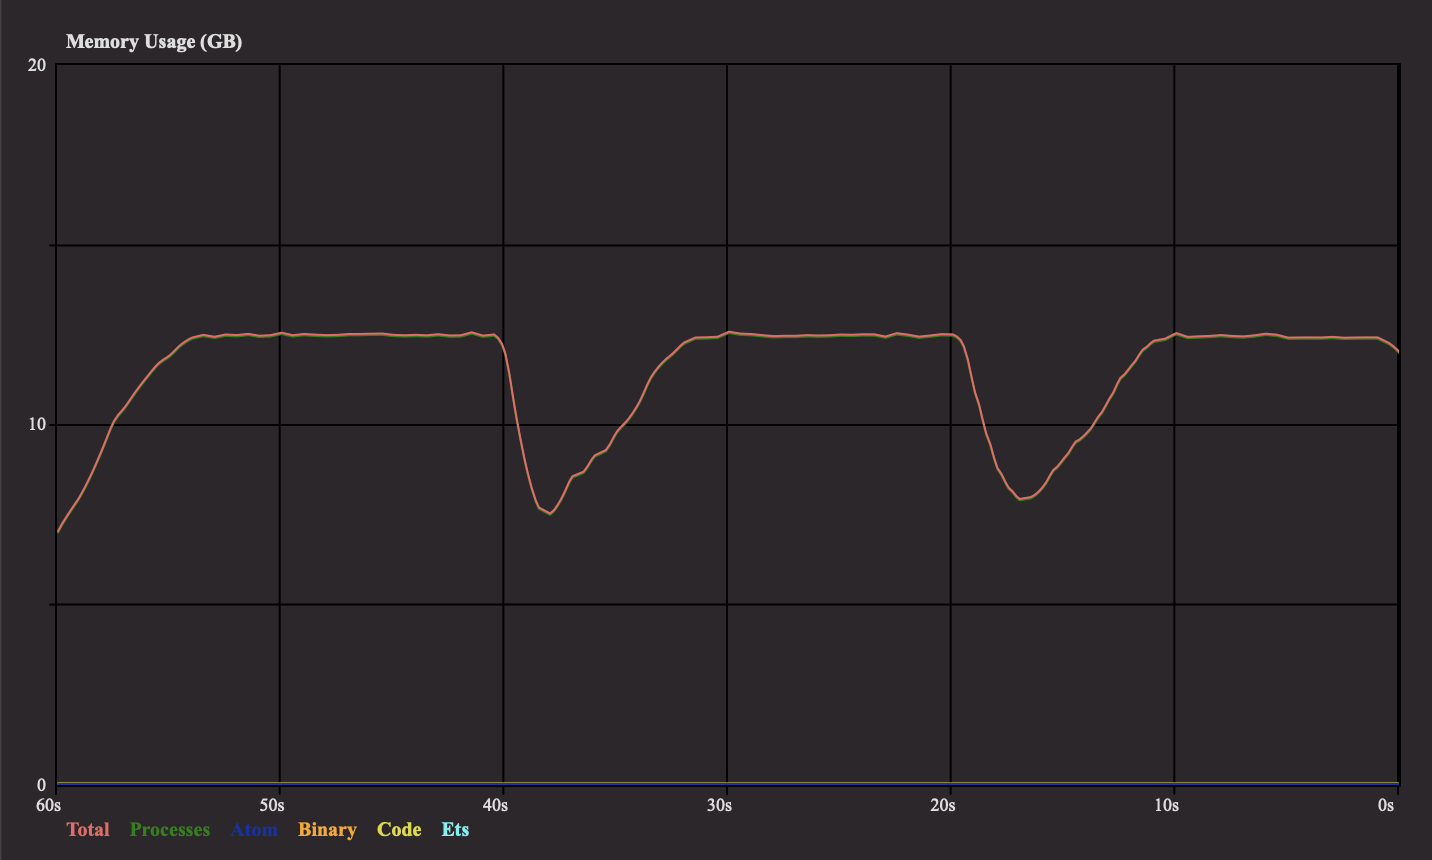
Below I attach a plot showcasing the memory usage of the program (note that the total memory usage consists almost only of the memory used by processes).
The test has been performed with 1000 GenServers, for a enumerable being a list of length 100_000, with an element being a small integer. For such a case I assume, that the enumerable’s size is:
length_of_array*(size_of_element) = length_of_array*(1+size_of_small_integer) = length_of_array*(1+1)=200_000 [words]
On my system, the word size is 8 bytes, which would mean that the memory needed by each process should be around 1_600_000 bytes = 1.6[MB]
For 1000 processes, the amount of memory needed at once shouldn’t exceed 1.6GB.
However, the amount of used memory seems to stabilize at around 12.5GB.
At around 40s and 20s on the timeline I forcefully invoke garbage collection, which shows that the amount of memory used can, in fact, be reduced. It’s not reduced to the expected level though.
I am aware that the garbage collection won’t occur everywhere time the enumerable gets out of scope, but shouldn’t it occur when the amount of memory used is so high that the node is using almost all available memory on the machine?
After brief research I have found out that this problem has already been discussed a few times, i.e. here - however, as far as I am concerned, in these cases, the problem was with the total memory used by a node skyrocketing (as a result of a raise in memory occupied by binaries, that weren’t freed). In my case, the problem is that there are processes that are using an enormously large amount of memory.
I have got a few questions:
- Has any of You ever experienced such behavior?
- What might be the possible reason for it? All the explanations but in my case, I am not operating on binaries so the amount of memory allocated for binaries is constant (as shown on the screenshot)
- What could be the solution to deal with that problem? Personally, I feel slightly guilty every time I invoke garbage collector on my own

I am looking forward to a reply from You and I wish you all the best,
Łukasz