I have an application that is seeing increasing memory usage and trying to pinpoint what’s causing it.
The app makes extensive use of Oban, having just a single endpoint to receive jobs with a payload and a callback URL. Other than that it has some auxiliary DB tables for holding access tokens to external services.
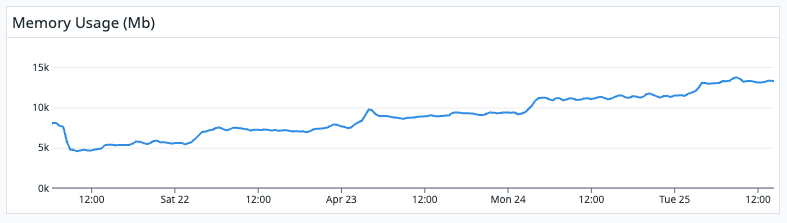
Here’s memory usage since last deployment on the 21st:
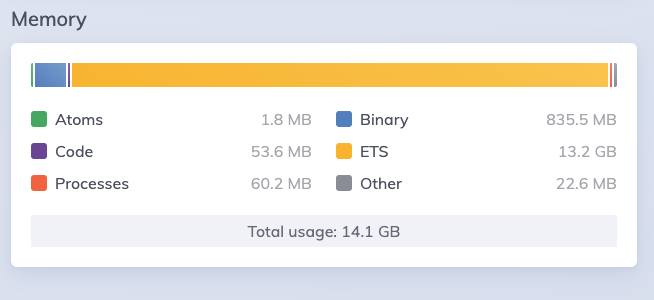
I remember reading that Ecto caches Query plans in ETS, but before I go hunt down this, I’d like to know if someone has faced this before and what should I look for. At this point I don’t even know what data is ecto caching, if that has any expiration or how what else.
Ecto caches your query string and the key is a combination of the contents of your query.
I don’t know if this is the issue but if you are not using query parameters then I think this could potentially increase the size of the cache dramatically. For example if you are issuing queries like this:
select * from table where column = 1;
select * from table where column = 2;
select * from table where column = 3;
select * from table where column = 4;
...
Instead of using a query parameter for the column value:
select * from table where column = $1
Then I think this could cause your issue. I believe the former are all saved as different cache entries while the latter is saved as one cache entry and the query parameter are substituted into it.
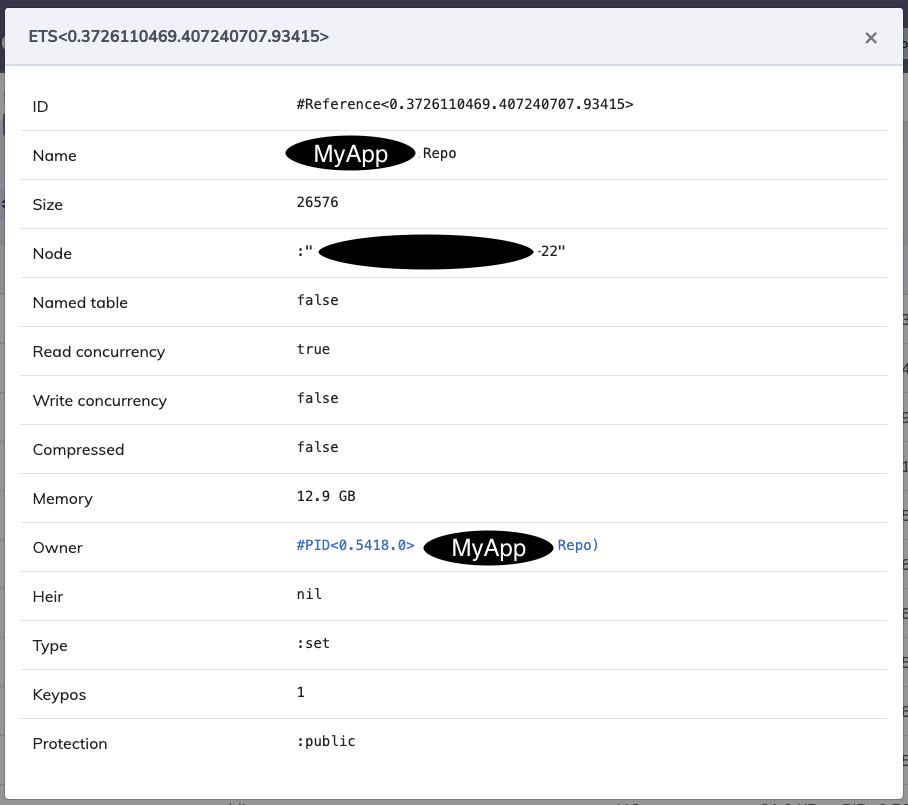
There is also an ets table in the drivers. It kind of smells like part of the query result is being put into ets but it is referencing a large binary and preventing garbage collection.
Postgrex gives you the option to copy or reference large binaries. If you are defining something like this it might cause your issue