High message queue on logger process

In one of our applications, we observe occasional spikes in the message queue length. The message queue length shoots up to more than 100k and then comes down. This also leads to high memory growth during that period (from 200M to about 800M).

From New Relic metrics, this seems due to the Logger process


I was under the assumption that logger would automatically switch to sync in these scenarios and there is no way the queue could get this high.

config :logger,
  utc_log: true,
  handle_otp_reports: true,
  sync_threshold: 100,
  handle_sasl_reports: true,
  backends: [:console, Core.ErrorLogger]

We use the above config. is it possible for the queue length to go this high even if IO or something else is slow?

It’s possible logger is getting messages from other sources than direct Logger.<level> calls - for example from the error_logger or from sasl - those can’t be controlled as easily. Do you have any clues into what kind of logs there are at times where the log queue spikes up?

1 Like

It’s possible logger is getting messages from other sources than direct Logger. calls - for example from the error_logger or from sasl - those can’t be controlled as easily.

We do enable sasl and other erlang libraries like brod might generate logs using error_logger. But during normal operation, they don’t generate much logs.

Do you have any clues into what kind of logs there are at times where the log queue spikes up?

I looked at one specific spike, it lasted for about 5 mins

But we seem to miss about 2 hours of logs from that node (this might be entirely due to other problems on our infra side). The quick stats shows top 30 module values (as reported by logger metadata) during the timeframe. It seems like almost all of them are generated via Logger.<level>

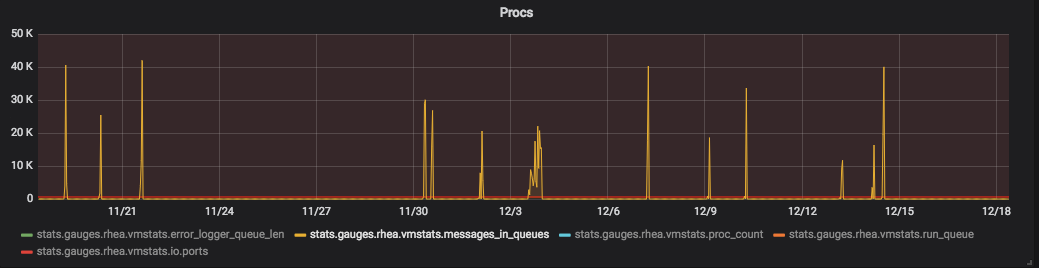
We were able to collect some info before the node crashed this time

> :recon.proc_count(:memory, 5)
[
  {#PID<0.1967.0>, 540730196,
   [
     Logger,
     {:current_function, {Logger.Backends.Console, :await_io, 1}},
     {:initial_call, {:proc_lib, :init_p, 5}}
   ]},
  {#PID<0.2201.0>, 10868184,
   [
     :vmstats_server,
     {:current_function, {:gen_server, :loop, 7}},
     {:initial_call, {:proc_lib, :init_p, 5}}
   ]},
  {#PID<0.1918.0>, 10543500,
   [
     :code_server,
     {:current_function, {:code_server, :loop, 1}},
     {:initial_call, {:erlang, :apply, 2}}
   ]},
  {#PID<0.1996.0>, 10010220,
   [
     :ssl_manager,
     {:current_function, {:gen_server, :loop, 7}},
     {:initial_call, {:proc_lib, :init_p, 5}}
   ]},
  {#PID<0.2016.0>, 2917916,
   [
     Tzdata.EtsHolder,
     {:current_function, {:gen_server, :loop, 7}},
     {:initial_call, {:proc_lib, :init_p, 5}}
   ]}
]
> :recon.proc_count(:message_queue_len, 5)
[
  {#PID<0.1967.0>, 823221,
   [
     Logger,
     {:current_function, {Logger.Backends.Console, :await_io, 1}},
     {:initial_call, {:proc_lib, :init_p, 5}}
   ]},
  {#PID<0.8648.524>, 1,
   [
     current_function: {Consumer.KafkaWorker.LoopGuard, :attempt, 4},
     initial_call: {:proc_lib, :init_p, 5}
   ]},
  {#PID<0.8897.931>, 0,
   [
     current_function: {:prim_inet, :recv0, 3},
     initial_call: {:erlang, :apply, 2}
   ]},
  {#PID<0.8258.931>, 0,
   [
     current_function: {:gen_statem, :loop_receive, 3},
     initial_call: {:proc_lib, :init_p, 5}
   ]},
  {#PID<0.7971.931>, 0,
   [
     current_function: {:tls_connection, :"-ensure_sender_terminate/2-fun-0-",
      1},
     initial_call: {:erlang, :apply, 2}
   ]}
]
> :recon.info('<0.1967.0>')
[
  meta: [
    registered_name: Logger,
    dictionary: [
      "$initial_call": {:gen_event, :init_it, 6},
      "$ancestors": [Logger.Supervisor, #PID<0.1965.0>]
    ],
    group_leader: #PID<0.1964.0>,
    status: :waiting
  ],
  signals: [
    links: [#PID<0.1968.0>, #PID<0.1970.0>, #PID<0.1971.0>, #PID<0.1966.0>],
    monitors: [process: #PID<0.1938.0>],
    monitored_by: [],
    trap_exit: true
  ],
  location: [
    initial_call: {:proc_lib, :init_p, 5},
    current_stacktrace: [
      {Logger.Backends.Console, :await_io, 1,
       [file: 'lib/logger/backends/console.ex', line: 173]},
      {Logger.Backends.Console, :handle_event, 2,
       [file: 'lib/logger/backends/console.ex', line: 56]},
      {:gen_event, :server_update, 4, [file: 'gen_event.erl', line: 577]},
      {:gen_event, :server_notify, 4, [file: 'gen_event.erl', line: 559]},
      {:gen_event, :server_notify, 4, [file: 'gen_event.erl', line: 561]},
      {:gen_event, :handle_msg, 6, [file: 'gen_event.erl', line: 300]},
      {:proc_lib, :init_p_do_apply, 3, [file: 'proc_lib.erl', line: 249]}
    ]
  ],
  memory_used: [
    memory: 545669148,
    message_queue_len: 826902,
    heap_size: 10958,
    total_heap_size: 59112578,
    garbage_collection: [
      max_heap_size: %{error_logger: true, kill: true, size: 0},
      min_bin_vheap_size: 46422,
      min_heap_size: 233,
      fullsweep_after: 65535,
      minor_gcs: 113
    ]
  ],
  work: [reductions: 144940639077]
]

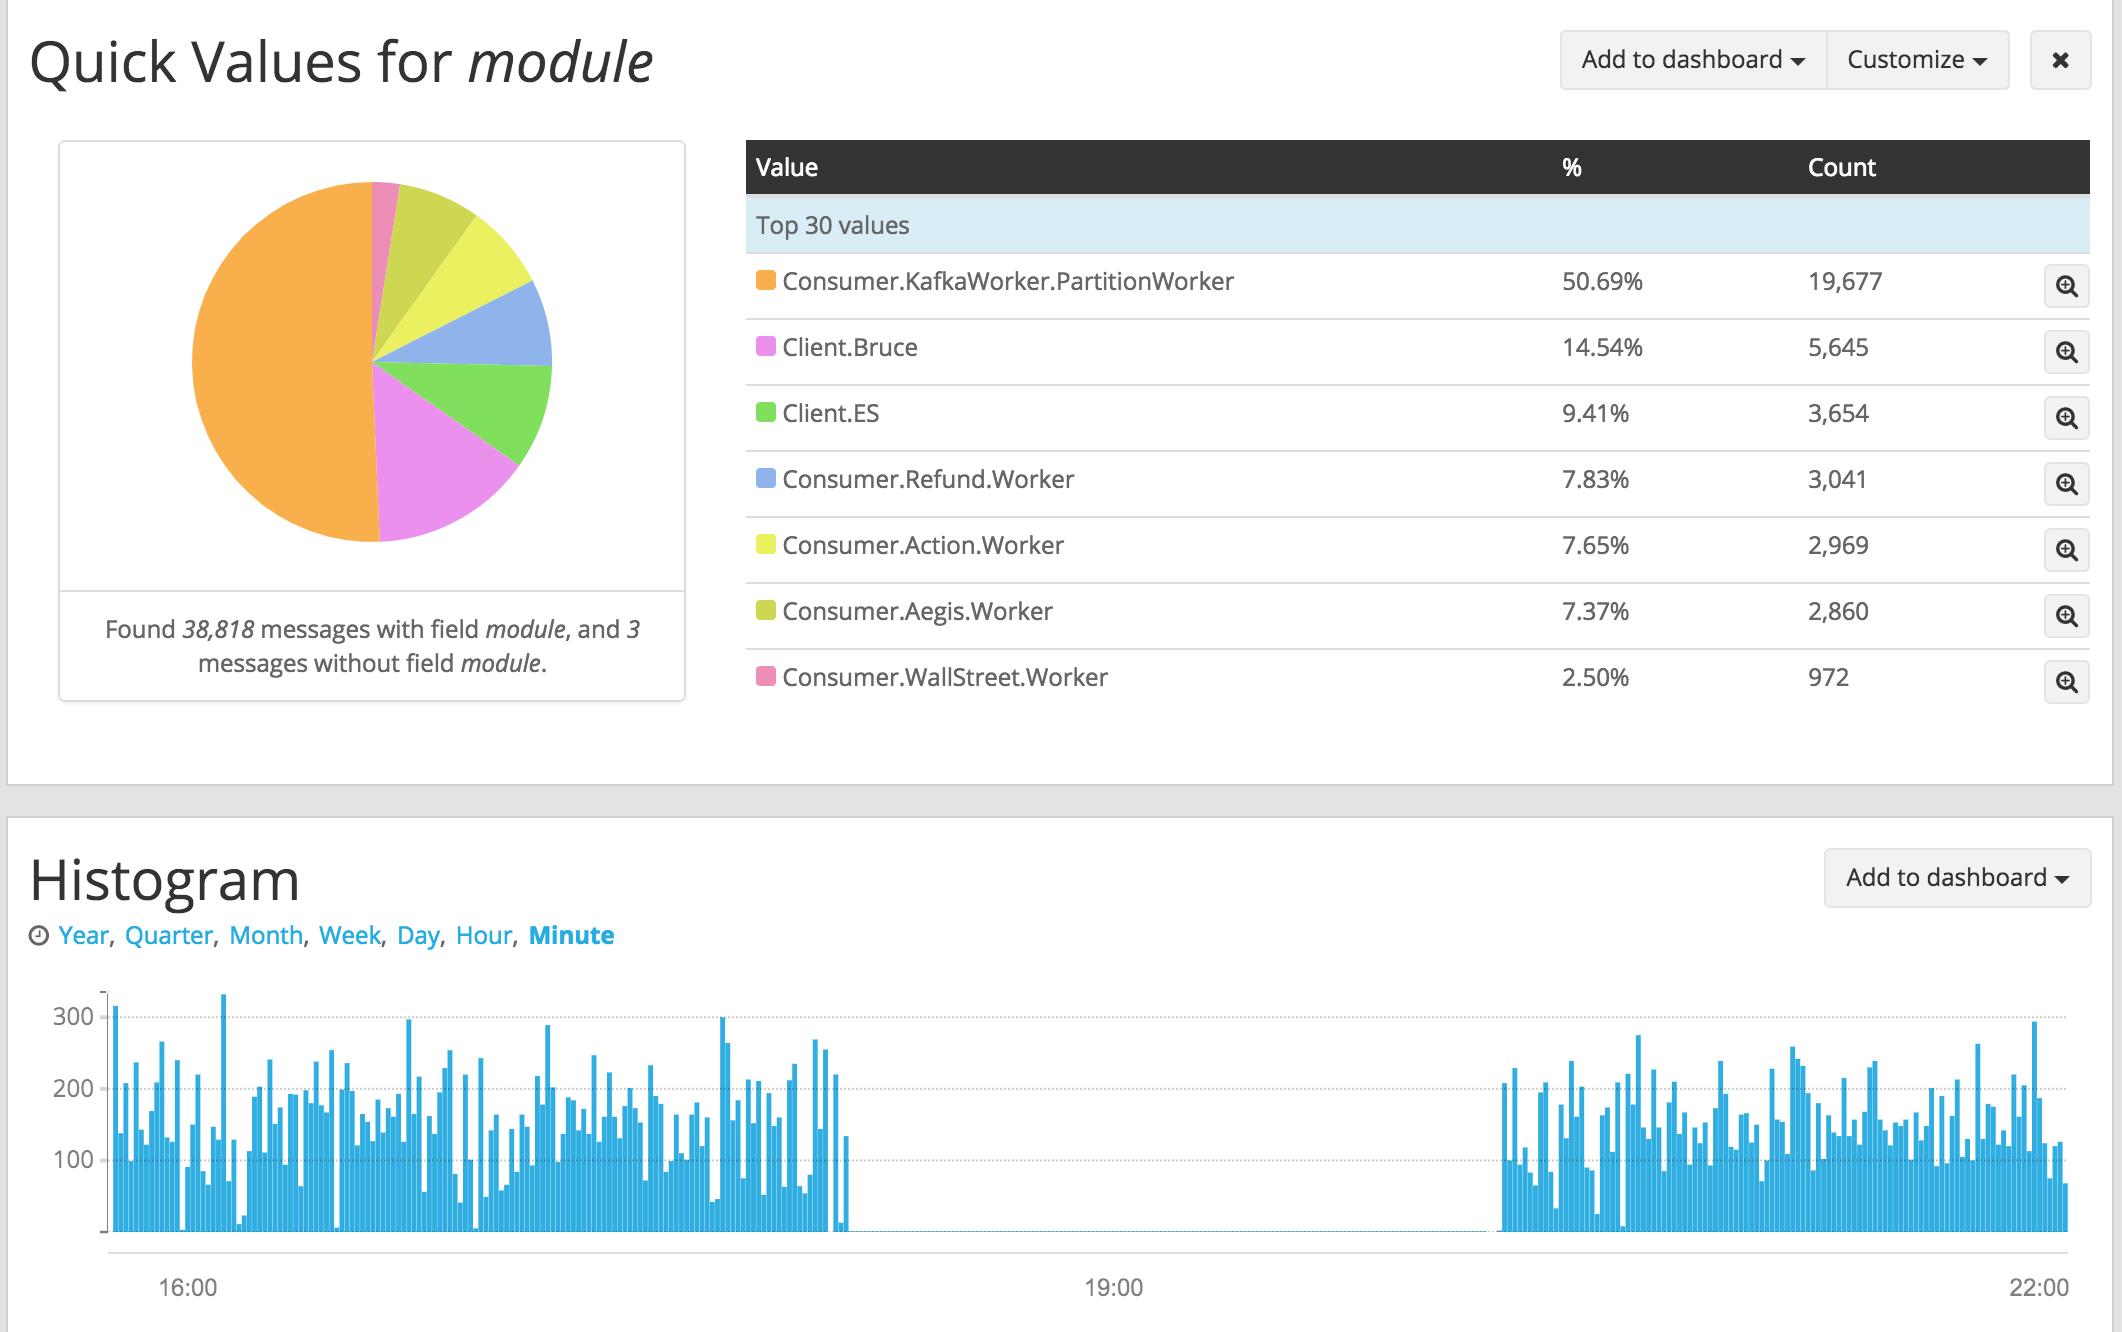
This atleast confirms that console backend is the one that has big message queue. Still wondering why it was not kicking the backpressure mechanism. From application metrics, it seems like all the processes were able continue to write logs (though nothing gets written to stdio) and make progress and we observe no application level errors during the timeframe either.

I have been trying to reproduce the issue locally

config :logger,
  utc_log: true,
  sync_threshold: 100,
  backends: [:console]
require Logger

# trace sync/async state
{:ok, _} = :dbg.tracer()
{:ok, _} = :dbg.p(:all, [:c])
{:ok, _} = :dbg.tp(Logger.Config, :__data__, :x)

# monitor memory
:observer.start()

defmodule Loop do
  def run() do
    Logger.info(inspect(:crypto.strong_rand_bytes(1024)))
    Process.sleep(10)
    run()
  end
end

for _i <- 1..100 do
  spawn(fn ->
    Loop.run()
  end)
end

Process.sleep(:infinity)

I am using Pipe Viewer tool to throttle the stdio rate

mix run generator.exs | pv -L 1k

Most of the time, the logger just stays in async mode

(<0.226.0>) returned from 'Elixir.Logger.Config':'__data__'/0 -> #{level =>
                                                                    debug,
                                                                   mode =>
                                                                    async,
                                                                   translators =>
                                                                    [{'Elixir.Logger.Translator',
                                                                      translate}],
                                                                   truncate =>
                                                                    8096,
                                                                   utc_log =>
                                                                    true}

But the message_queue on the console backend keep increasing

From reading the code, it looks the message_queue length of a single handler (Logger.Config) is used to throttle the logger. So is it possible for other handlers like console to lag behind but the logger keeps thinking there is enough capacity left? \cc @michalmuskala @josevalim

1 Like

All of the handlers are installed in the same process, so we don’t need to track it per handler. I will take a look at your reproduction script.

What are your Erlang/OTP and Elixir versions? I cannot reproduce this on Erlang/OTP 21 and Elixir v1.7. The logger enters into discard message and most messages are then discarded.

It is worth noting that if a handler blocks for a long period of time for some reason, then we will be unable to detect the overload while the handler is blocked. However, after running it multiple times, the maximum it got was 70k messages and memory never went higher than 30MB. Are you using other handlers in production? Can you make sure they are not blocking?

What are your Erlang/OTP and Elixir versions?

Erlang/OTP 21 [erts-10.1.1] [source] [64-bit] [smp:8:8] [ds:8:8:10] [async-threads:1] [hipe] [dtrace]

Elixir 1.7.3 (compiled with Erlang/OTP 21)

It is worth noting that if a handler blocks for a long period of time for some reason, then we will be unable to detect the overload while the handler is blocked. However, after running it multiple times, the maximum it got was 70k messages and memory never went higher than 30MB. Are you using other handlers in production? Can you make sure they are not blocking?

We have an error logger, but there were no errors during that time (it’s also async and starts to discards if more than 10 requests are pending)

Interesting, that should work just fine then. Locally I am having the same results as you, the message queue grows, but as in your example, it doesn’t go over 20-30MB and then it enters into discard. Notice you cannot look at the mode in your log results because they are quite delayed. Instead, you can check the Logger.Config table in Observer.

In any case, I have been thinking about this and I may have come up with a better approach for doing back-pressure that will be a bit more resilient to the handler blocking, I will follow up here once I have a POC.

1 Like

Here you go: https://github.com/elixir-lang/elixir/pull/8567

For your script it never goes over 200 messages in the inbox.

3 Likes

Is there a way to learn when the logger drops messages? We have jobs that fail sometimes and record which attempt they’re on, and often will only see logs for ~3 of 10 attempts.

In master (without this PR) we do log them. Is there a chance you are missing those messages because the system is overloaded?

1 Like

In production we’re on 1.7.4, which kind of log message should I be looking for? Apologies if this is documented somewhere, I’ve done a cursory look and not spotted what I’m looking for yet.

1 Like

Unfortunately (or fortunately?) not documented anywhere. Here you go: https://github.com/elixir-lang/elixir/blob/v1.7/lib/logger/lib/logger/config.ex#L110-L121

2 Likes

I’ve encountered an issue in production which I think might be related to the above subject. Log entries are missing from the log files. I perused the log files to see if messages are being discarded - there’s no log indicating that. What else can be done in terms of troubleshooting. Thanks.