I think now it’s a time range problem - see that Sep 29 to a few seconds ago (top right corner)? Click on it and select say last 5 minutes. btw we have #prometheus channel on elixir lang slack.
This isn’t 100% official yet (e.g. there is no blog post yet and stuff) but there is a pre alpha version of a phoenix agent for skylight (which people might know from ruby) - I haven’t tried it out yet and was told that you might still need the ruby gem to create a “fake ruby app” - the skylight client is here: https://github.com/skylightio/skylight-phoenix
No I don’t work for skylight, I use it at work and know people from there that’s how I know and got the ok to post this
Happy that they do it and hope I get some time at work next week to try it out and plug it in - also happy for some competition and growth in the elixir/phoenix application performance monitoring market!
Although I haven’t tried this particular library, I’ve been extremely happy with Airbrake over the years. IMO, for the price it’s really hard to beat for all of the information that it gives you.
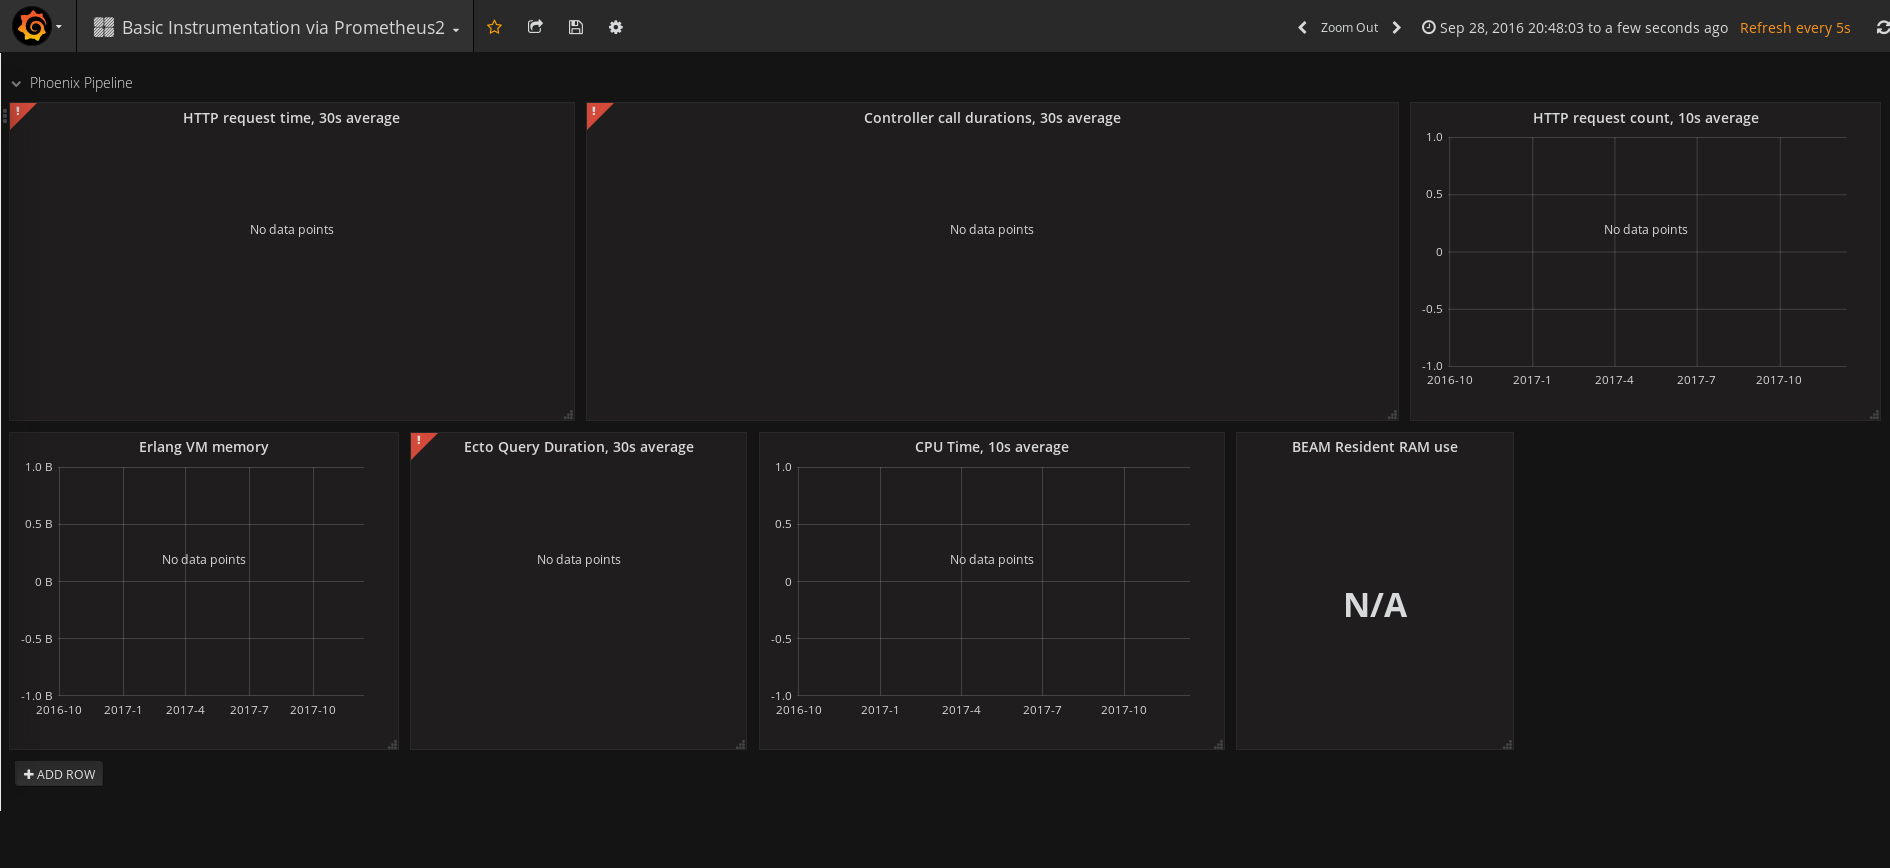
@deadtrickster I tried to use the libs and followed aldusleaf.org but I’m getting an error: x.a.valueFormats[e] is not a function, and all my charts are blank. Any hints? also, no errors from the elixir, I’m using the lastest grafana and prometheus.
Hello, that posts is unfortunately a bit outdated now. Grafana updated its format handling, you can fix it easily yourself by editing respective sections of the red-triangled graphs.
If you still don’t see your data, please check data source name.
I think the problem is prometheus not receiving Phoenix and Ecto metrics, but I followed the entire guide, and checked twice, is something I’m doing wrong?
can you join as on elixir-lang slack? channel is #prometheus.
But generally, if you don’t see your metrics in grafana, you should go to prometheus console and check target statuses and try to render metrics using raw prometheus graph page.
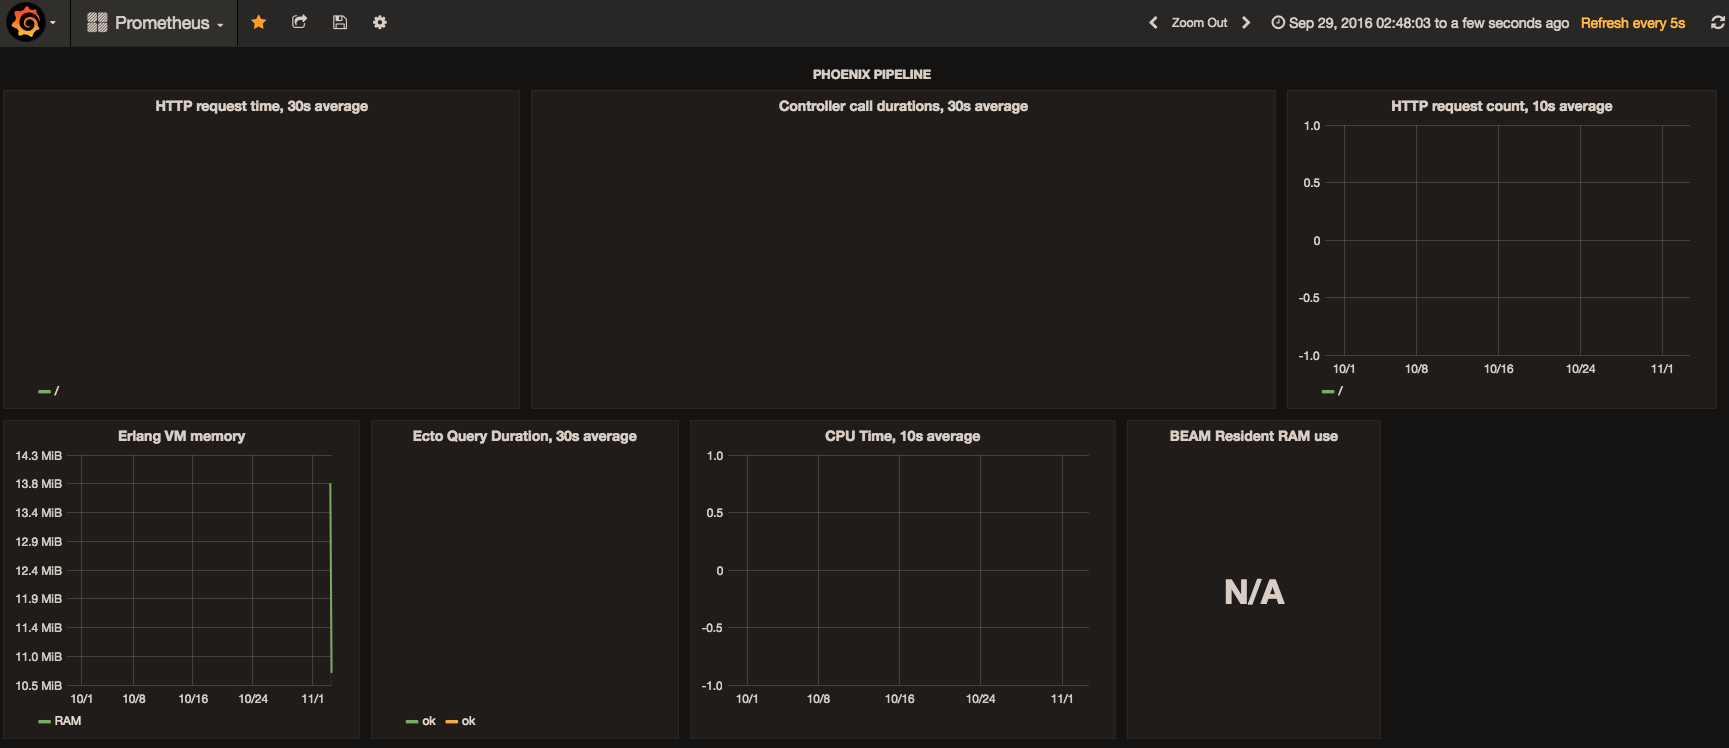
 I think now it’s a time range problem - see that Sep 29 to a few seconds ago (top right corner)? Click on it and select say last 5 minutes. btw we have
  now I can see two charts, others are still blank, but it’s getting better