Can you upload your code and dashboard somewhere? also there is #prometheus channel on Freenode you can ask Prometheus creates here directly.
1 Like
I released stable versions of my Prometheus stuff and created a topic for the announcement: Prometheus.io Elixir integrations
3 Likes
AppSignal finally supports Elixir / Phoenix apps (beta). And it works pretty well!
I think you can even use it for free as long it is in beta. Supports Slack Notifications and much more.
2 Likes
I’ve started using the AppSignal and it’s quite nice. The major bummer (for me) is that it does not support Phoenix Channels yet and that support isn’t planned for 1.0. For an app that mainly uses channels, it severely limits its use. Otherwise it looks nice.
For error monitoring we still use our own wrapper for bugsnag: Bugsnex - we’ve been running it in production and it works fine so far. Bad thing is that for channels as we didn’t spend too much time digging in Phoenix you gotta wrap them in a Bugsnex.handle_errors.
1 Like
AppSignal looks nice, but I have big objections when it comes to the implementation. It uses NIFs, we know nothing about. We know they’re going to do some HTTP requests, but are they running in a separate thread? Are they respecting the NIF time limit? I don’t think I’m comfortable with sticking proprietary NIFs into my code, where I have no idea they won’t cause a scheduler collapse under load.
4 Likes
Hi, the creator of the Appsignal elixir integration speaking… 
The Appsignal NIF works as follows: it fork/execs a separate agent process, to which the NIF sends its data (protobuf) over a unix socket. The agent process takes care of sending it the the server. The C library that the NIF interfaces is specifically written with performance in mind and is very robust and battle tested; written in Rust and it is the same code that the Ruby AppSignal Gem uses, which is used in production in thousands of sites.
I had the same issues before with this approach but from a business and maintainability point it is understandable because they are planning more language integrations in the future (PHP, Java) which all will use this same C library and agent process.
2 Likes
The main thing about not supporting channels yet is that there is no UI on the AppSignal web interface to display it yet. We are also not really sure how to do this yet. Rails has a similar concept, ActionCable, which would probably have the same web interface.
But there is nothing that stops one from using the Appsignal.Transaction functions directly to monitor channel requests. Maybe I should do a writeup on how to do that… 
2 Likes
Thanks! Keep it going
Although I sometimes wonder how monitoring services are that obsessed with the UI - yes it’s cool and great to have a good UI for it. But rather than nothing I’d be perfectly happy with having just another tab that shows the same performance data etc. but for my channels. (Adding wondered, as skylight told me the major reason they don’t have background worker monitoring is also UI).
1 Like
Inspired by our discussion, a few days ago I’ve released a new version of the library with basic channel support; basically you can treat the processing of incoming channel messages as separate transactions. Hope that helps a bit already
Note that the API is not the prettiest yet. In a future version I’m planning to incorporate function annotations to make the integration a bit cleaner.
4 Likes
Thank you, that’s great! I’ll only be back working on the project next year but I’ll forward it to my colleagues
2 Likes
I am new to phoenix, so, which package to install in-order to monitor phoenix? I am not sure which one…
1 Like
Read this post first: http://aldusleaf.org/monitoring-elixir-apps-in-2016-prometheus-and-grafana/
Libraries are listed here: Prometheus.io Elixir integrations
Github link: https://github.com/deadtrickster/prometheus.ex see Integrations section in readme.
4 Likes
I have followed all the instructions, got grafana running, and installed prometheus packages, then I got this error:
Server: localhost:4000 (http)
Request: GET /metrics
** (exit) an exception was raised:
    ** (UndefinedFunctionError) function :prometheus_process_collector.collect_mf/2 is undefined (module :prometheus_process_collector is not available)
        (prometheus_process_collector) :prometheus_process_collector.collect_mf(:default, #Function<1.12788421/1 in :prometheus_protobuf_format.registry_collect_callback/3>)
        (prometheus) /Users/samir/Documents/projects/elixir/deps/prometheus/src/prometheus_collector.erl:157: :prometheus_collector.collect_mf/3
        (prometheus) /Users/samir/Documents/projects/elixir/deps/prometheus/src/prometheus_registry.erl:58: :prometheus_registry."-collect/2-lc$^0/1-0-"/3
        (prometheus) /Users/samir/Documents/projects/elixir/deps/prometheus/src/prometheus_registry.erl:58: :prometheus_registry.collect/2
        (prometheus) /Users/samir/Documents/projects/elixir/deps/prometheus/src/formats/prometheus_protobuf_format.erl:45: :prometheus_protobuf_format.format/1
        (prometheus) /Users/samir/Documents/projects/elixir/deps/prometheus/src/metrics/prometheus_summary.erl:232: :prometheus_summary.observe_duration/4
        (app) lib/metrics/prometheus_exporter.ex:2: App.Metrics.PrometheusExporter.scrape_data/1
        (app) lib/metrics/prometheus_exporter.ex:2: App.Metrics.PrometheusExporter.call/2
        (app) lib/app/endpoint.ex:1: App.Endpoint.phoenix_pipeline/1
        (app) lib/plug/debugger.ex:122: App.Endpoint."call (overridable 3)"/2
        (app) lib/app/endpoint.ex:1: App.Endpoint.call/2
        (plug) lib/plug/adapters/cowboy/handler.ex:15: Plug.Adapters.Cowboy.Handler.upgrade/4
        (cowboy) src/cowboy_protocol.erl:442: :cowboy_protocol.execute/4
I am on Mac Sierra, OTP 19
Please advice if I have to use some docker image to make things easier, or to specify the OS that I can test with?
1 Like
@sabri, prometheus_process_collector is linux only currently. If you are not using it and you followed linked blog post make sure you don’t have this line: Prometheus.Registry.register_collector(:prometheus_process_collector)
1 Like
But what the concequces of commenting the line:?
Prometheus.Registry.register_collector(:prometheus_process_collector)
Also, in Grafana, could you please see the error below:
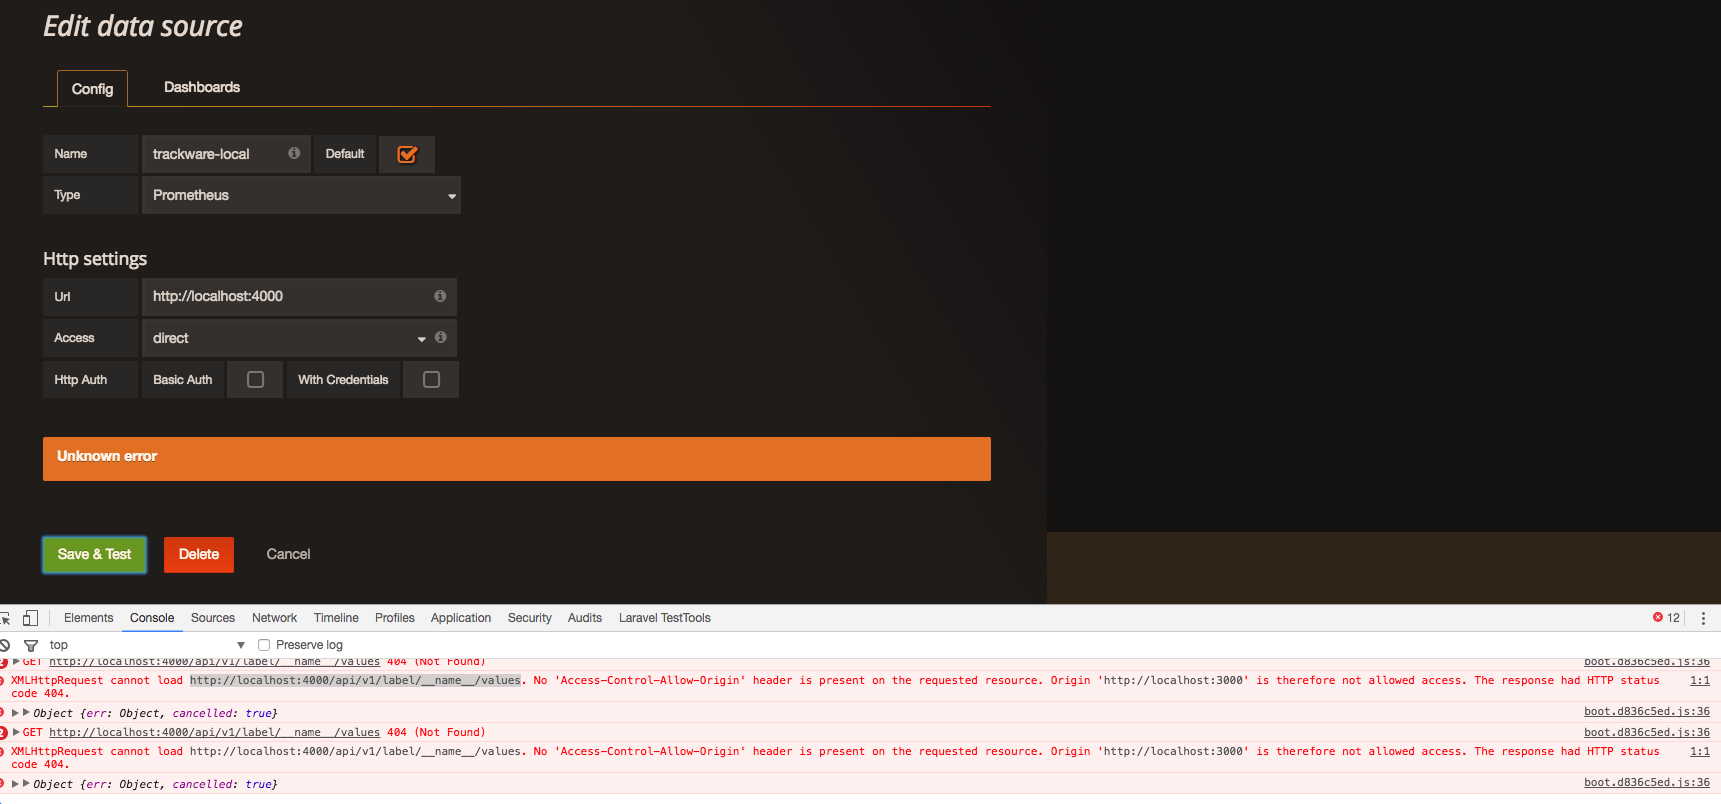
1 Like
@sabri
You should set URL to your prometheus instance URL (default is http://localhost:9090/) not your Phoenix instance.
1 Like
If you’re working for a company with resources and don’t mind spending some cash I recently saw ESL give a talk on something called WombatOAM which has the advantage of being useable by non-developers (perhaps an operations team).
Apparently its super easy to plug into your infrastructure and the demo they had was quite nice…
1 Like
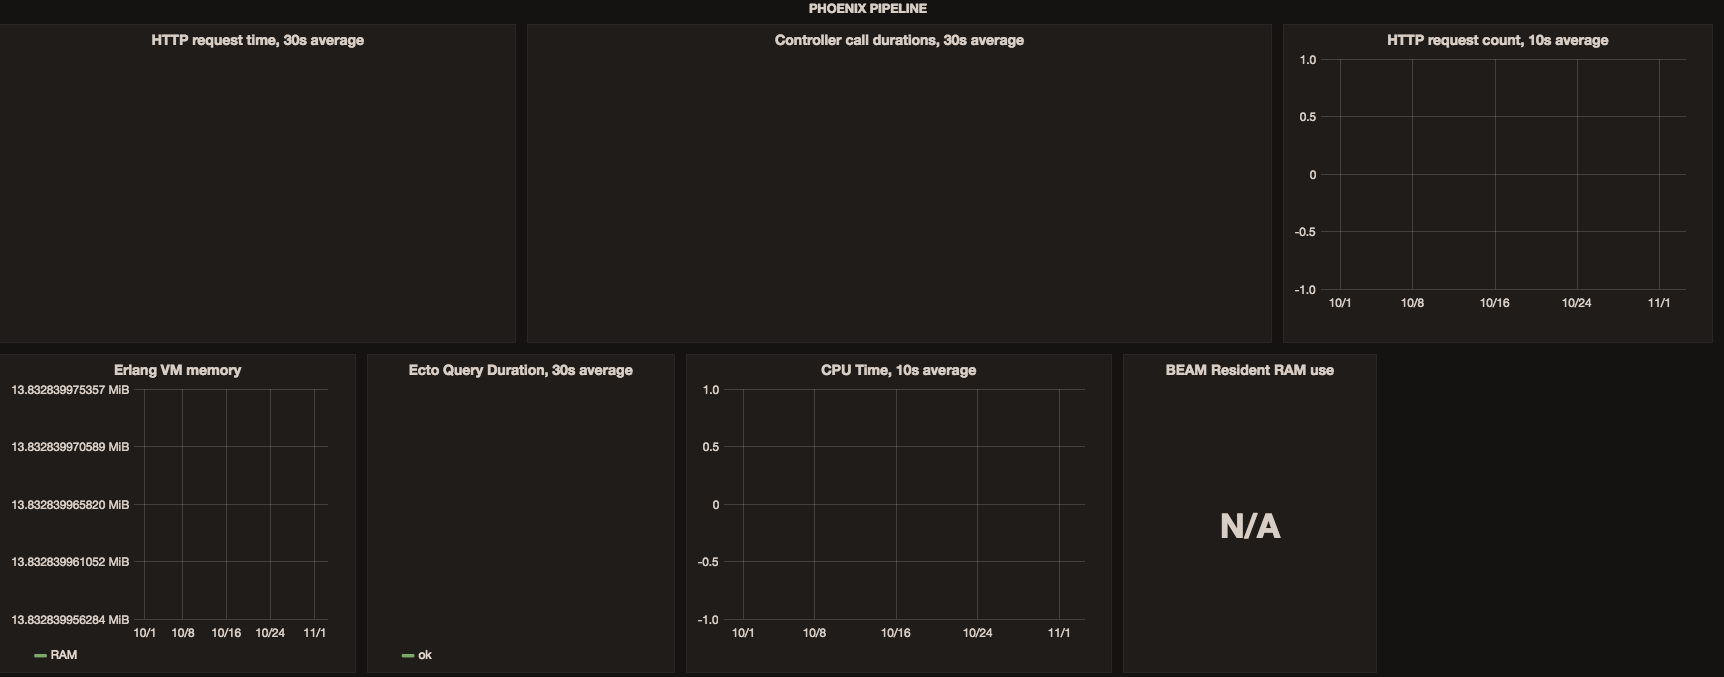
Oh, thanks, I got it, now, but without any readings in dashboard, is that because I commented line:
Prometheus.Registry.register_collector(:prometheus_process_collector) ?
@hazardfn I tried to ask WombatOAM for a trial access, but, I didn’t get any reply…
1 Like
if you imported dashboard from the gist, please make sure your prometheus datasource’s name is “Prometheus”. https://gist.github.com/skosch/415b86ef6a87e3dc102d7f72669bfb1b#file-grafana_dashboard-json-L5. I think you named yours as trackware-local.
1 Like
If you don’t want to rename your datasource you can edit graphs and select yours from the dropdown
1 Like


