Hello fellow learners.
I am creating charts in my elixir project using the Contex library (Contex — ContEx v0.5.0).
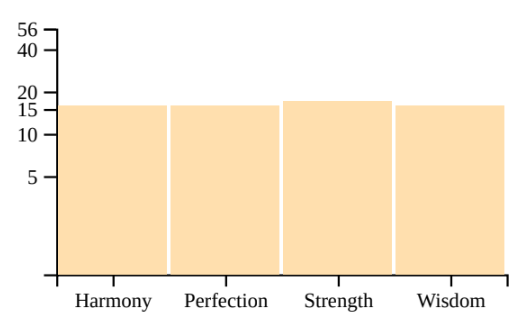
I have created a bar chart. In that chart, I want to set the highest tick value of the y-axis to 56. I have used tick_positions to do it. But my chart looks messy.

This is my chart. I just used tick_positions so that I could set the highest y-axis value. I have also found that the range in context is used to set the range axis. But I don’t how to do it in my code. So how should I use range in my code to set range for my y-axis?
Below is the option for the Barchart
      options = [
        custom_value_scale:
          Contex.ContinuousLogScale.new(
            domain: {0, 56},
            tick_positions: [5, 10, 15, 20, 40, 56],
            negative_numbers: :mask
          ),
          colour_palette: ["ffdfae"],
          data_labels: false,
        ]
Even if the values for the bars are less than 56, I need the 56 to have appeared.


