
bennydreamtech23
How to Use OpenTelemetry, PromEx, and Promtail to Build an Observability System with OpenObserver Exporter in Elixir
Observability is a key part of building scalable and maintainable applications. Today, I want to share how to set up one of the most powerful observability stacks in Elixir using tracing, metrics, and logging. Together, these help you monitor performance, detect bottlenecks, and improve system reliability.
First, I want to thank God for His guidance in helping me understand and set up these tools, my supervisor for his support, and @smaller_infinity from Elixir forum channel for clearing doubts and giving invaluable insights.
Why Observability Matters
-
Tracing: Tracks the performance of your application and helps find bottlenecks.
-
Metrics: Measures the system’s behavior and performance over time.
-
Logs: Provides insight into system events and application state.
Combining these three gives a full picture of your system’s health and improves scalability.
Packages Needed
Here’s a breakdown of the packages we’ll use:
OpenTelemetry & Auto-Instrumentation
{:opentelemetry, "~> 1.3"}
{:opentelemetry_api, "~> 1.2"}
{:opentelemetry_exporter, "~> 1.6"}
{:opentelemetry_phoenix, "~> 1.1"}
{:opentelemetry_cowboy, "~> 0.2"}
{:opentelemetry_ecto, "~> 1.2"}
{:opentelemetry_logger_metadata, "~> 0.2.0"}
{:opentelemetry_liveview, "~> 1.0.0-rc.4"}
{:opentelemetry_telemetry, "~> 1.0.0-beta.7"}
Purpose of each library:
-
opentelemetry&opentelemetry_api: Core OpenTelemetry tracing libraries. -
opentelemetry_exporter: Exports traces to your observability system (OpenObserver). -
opentelemetry_phoenix: Auto-instrument Phoenix requests. -
opentelemetry_cowboy: Auto-instrument Cowboy requests. -
opentelemetry_ecto: Auto-instrument database queries. -
opentelemetry_logger_metadata: Attach logger metadata to traces. -
opentelemetry_liveview: Instrument LiveView events automatically. -
opentelemetry_telemetry: Bridges telemetry events to OpenTelemetry.
Metrics & Logs
{:prom_ex, "~> 1.9.0"}
{:logger_json, "~> 7.0"}
{:otel_http, "~> 0.2.0"}
{:jason, "~> 1.2"}
{:telemetry_metrics, "~> 0.6"}
{:telemetry_poller, "~> 1.0"}
{:logger_file_backend, "~> 0.0.10"}
-
prom_ex: Exposes metrics to Prometheus. -
logger_json: Structured JSON logging. -
otel_http: Adds HTTP instrumentation. -
telemetry_metrics&telemetry_poller: Collect and export telemetry metrics. -
logger_file_backend: Writes logs to files.
Setting Up Tracing

- Application Configuration in
application.ex:
def start(_type, _args) do
  # OpenTelemetry Instrumentation
  :opentelemetry_cowboy.setup()
  OpentelemetryPhoenix.setup(adapter: :cowboy2)
  OpentelemetryEcto.setup([:myApp, :repo])
  OpentelemetryLoggerMetadata.setup()
  OpentelemetryLiveView.setup()

  children = [
    MyApp.Repo,
    MyApp.Endpoint
  ]

  opts = [strategy: :one_for_one, name: MyApp.Supervisor]
  Supervisor.start_link(children, opts)
end
- Configuration in
config.exs:
config :opentelemetry,
  traces_exporter: :otlp,
  metrics_exporter: :otlp,
  span_processor: :batch,
  resource: %{service: %{name: "MyApp_ServiceName"}}

config :opentelemetry_exporter,
  otlp_protocol: :http_protobuf,
  otlp_endpoint: System.get_env("OTEL_EXPORTER_OTLP_ENDPOINT")
- Environment Variables:
Create a .env file and set:
export OTEL_TRACES_EXPORTER="otlp"
export OTEL_EXPORTER_OTLP_COMPRESSION="gzip"
export OTEL_EXPORTER_OTLP_HEADERS="Authorization=Basic <base64-username-password>"
export OTEL_RESOURCE_ATTRIBUTES="service.name=MyApp-dev,service.namespace=MyApp,deployment.environment=development"
export OTEL_EXPORTER_OTLP_ENDPOINT="<endpoint-from-OpenObserver or your own>"
export OTEL_EXPORTER_OTLP_PROTOCOL="http/protobuf"
- Start the Application:
mix deps.get
source .env
mix phx.server
After starting the app, visit your OpenObserver dashboard to see your traces in real-time.
This setup gives you automatic instrumentation for Phoenix, Cowboy, Ecto, and LiveView, while exporting traces to OpenObserver, providing a full observability of distributed tracing in elixir
Setting Up Metrics with PromEx
The second pillar of observability is metrics. In Elixir, we can use the PromEx library to collect and expose metrics to Prometheus (or any remote monitoring system like OpenObserver).
1. Install PromEx
Add PromEx to your mix.exs:
{:prom_ex, "~> 1.9.0"}
Then run:
mix deps.get
2. Generate PromEx Configuration
Run the PromEx generator:
mix prom_ex.gen.config --datasource YOUR_PROMETHEUS_DATASOURCE_ID
This will create a PromEx module with default settings. You can also add more libraries or custom metrics later—just follow the PromEx documentation to avoid errors from invalid configurations.
3. Add PromEx to Your Application
In application.ex, add MyApp.PromEx to your children array:
children = [
  MyApp.Repo,
  MyApp.Endpoint,
  MyApp.PromEx
]
4. Plug PromEx into Endpoint
In endpoint.ex, add the PromEx plug before the Plug.RequestId line:
plug PromEx.Plug, prom_ex_module: MyApp.PromEx
plug Plug.RequestId
plug Plug.Telemetry, event_prefix: [:phoenix, :endpoint]
This ensures metrics are collected for each HTTP request.
5. Configure Prometheus Remote Write
Create a prometheus.yml file:
global:
  scrape_interval: 15s

scrape_configs:
  - job_name: 'elixir-app'
    static_configs:
      - targets: ['172.17.0.1:4000']
    metrics_path: /metrics
    scrape_interval: 10s

remote_write:
  - url: "https://api.openobserve.ai/api/32v/prometheus/api/v1/write"
    basic_auth:
      username: "username_from_remote_write"
      password: "password_from_remote_write"
    queue_config:
      max_samples_per_send: 10000
Notes:
-
Replace
username_from_remote_writeandpassword_from_remote_writewith your OpenObserver credentials. -
Copy the
remote_writeURL exactly from your OpenObserver dashboard.
6. Run Prometheus with Docker
Create a docker-compose.yml:
version: '3.8'

services:
  prometheus:
    image: prom/prometheus:latest
    container_name: prometheus
    restart: unless-stopped
    ports:
      - "9090:9090"
    volumes:
      - ./prometheus.yml:/etc/prometheus/prometheus.yml:ro
    extra_hosts:
      - "host.docker.internal:host-gateway"
Then start Prometheus:
docker-compose up -d
7. Ensure Endpoint is Accessible
In dev.exs, configure your Phoenix endpoint to allow access:
config :myApp, MyAppWeb.Endpoint,
  http: [ip: {0, 0, 0, 0}, port: 4000]
This binds the server to all interfaces, allowing Prometheus to scrape metrics from Docker.
8. Check Observability System
-
Start your Phoenix app:
mix phx.server. -
Start Prometheus:
docker-compose up. -
Go to OpenObserver and verify that metrics appear.
-
If you don’t see metrics, check Docker logs for Prometheus and debug networking or authentication issues.
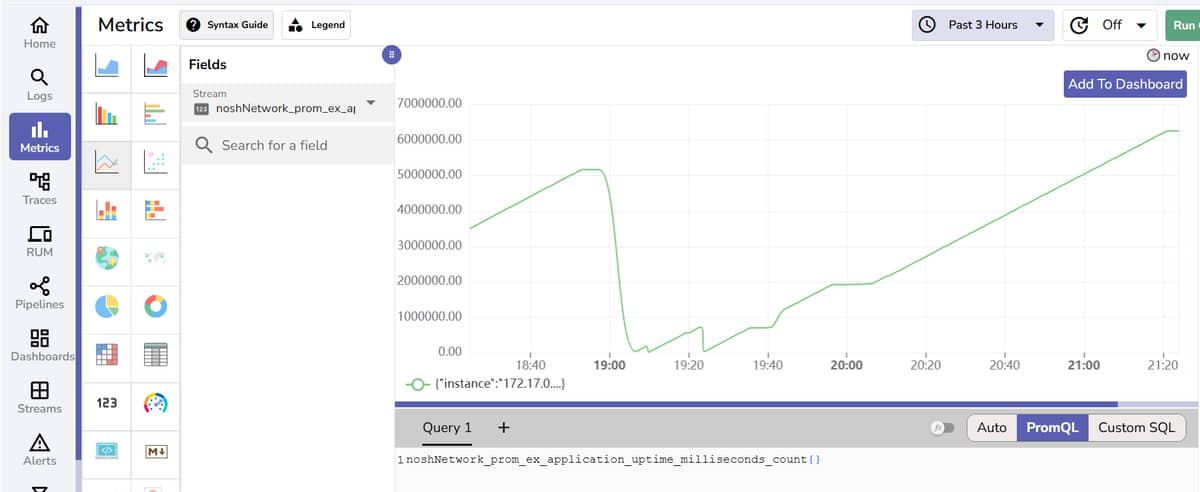
This setup gives you real-time application metrics exported from Elixir to OpenObserver using PromEx and Prometheus. Combined with tracing, this forms the second pillar of your observability stack.
Perfect! Let’s structure your logs section for your article so it’s clear, step-by-step, and easy to follow.

Setting Up Logs with LoggerJSON and Promtail/Filebeat
The third pillar of observability is logs. Unlike tracing and metrics, logs aren’t fully supported in OpenTelemetry yet for Elixir, and setting up an OTEL collector can be complex. Thanks to smaller_infinity, we can use Promtail (or Filebeat) to ship logs to an observability system like OpenObserver.
1. Install Logger File Backend
Add the file backend for structured logging:
{:logger_file_backend, "~> 0.0.10"},
{:logger_json, "~> 7.0"}
2. Configure Logger in config.exs
# Use both console and file backends
config :logger,
  backends: [:console, {LoggerFileBackend, :file}]

# Console backend with JSON formatting
config :logger, :console,
  formatter: {LoggerJSON.Formatters.Elastic,
              metadata: [:request_id, :user_id, :status, :trace_id, :span_id]}

# File backend with JSON formatting
config :logger, :file,
  path: "log/error_success.log", # Path where logs will be saved
  level: :info,
  formatter: {LoggerJSON.Formatters.Elastic,
              metadata: [:request_id, :user_id, :status, :trace_id, :span_id]}
This ensures that all logs are saved in JSON format, which is required by Promtail or Filebeat.
3. Promtail Setup
Create a promtail-config.yml:
server:
  http_listen_port: 9080
  grpc_listen_port: 0

positions:
  filename: /tmp/positions.yaml

clients:
  - url: "observability_endpoint_url"
    basic_auth:
      username: "username"
      password: "password"

scrape_configs:
  - job_name: myAPP_logs
    static_configs:
      - targets: ["localhost"]
        labels:
          job: elixir
          __path__: /var/log/elixir/error_success.log # Match the mounted volume
Then run Promtail in Docker:
promtail:
  image: grafana/promtail:latest
  container_name: promtail
  volumes:
    - /home/systemname/Myapp/log:/var/log/elixir:ro
    - ./promtail-config.yml:/etc/promtail/config.yml
  command: -config.file=/etc/promtail/config.yml
  ports:
    - "9080:9080"
4. Alternative: Filebeat Setup
If you don’t have JSON logs, Filebeat is a better option. Create a filebeat.yml:
setup.ilm.enabled: false
setup.template.enabled: false

filebeat.inputs:
- type: log
  enabled: true
  paths:
    - /var/log/elixir/error_success.log # Mounted volume path

output.elasticsearch:
  hosts: ["https://api.openobserve.ai:443"]
  timeout: 10
  path: "/api/32vB2Af8Wk5vQWvwBcFfMANde8n/" # Your organization ID
  index: "default"
  username: "username"
  password: "password"

processors:
- dissect:
    tokenizer: "%{timestamp} [%{level}] %{message}"
    field: "message"
    target_prefix: "elixir"
Run Filebeat in Docker:
filebeat:
  image: docker.elastic.co/beats/filebeat:8.11.0
  container_name: filebeat
  user: root
  volumes:
    - /home/systemname/appname/log:/var/log/elixir:ro
    - ./filebeat.yml:/usr/share/filebeat/filebeat.yml:ro
  command: filebeat -e -strict.perms=false
  ports:
    - "5066:5066"
5. Verify Logs
-
Start your Phoenix app:
mix phx.server. -
Start Promtail/Filebeat:
docker-compose up. -
Refresh your OpenObserver dashboard to see the logs.
-
Check Docker logs if logs are not appearing.
![]() This completes the full observability stack in Elixir:
This completes the full observability stack in Elixir:
-
Tracing: OpenTelemetry → OpenObserver
-
Metrics: PromEx + Prometheus → OpenObserver
-
Logs: LoggerJSON → Promtail/Filebeat → OpenObserver
Now you have a scalable, maintainable observability system.
Popular in Guides/Tuts


Other popular topics


 Latest Phoenix Threads
Latest on Elixir Forum
Sponsor Spotlight

Practical resources that improve the lives of professional developers.
Categories:
Sub Categories:
Forums
Popular Tags
- #ecto
- #liveview
- #troubleshooting
- #learning-elixir
- #deployment
- #library
- #erlang
- #testing
- #genserver
- #mix
- #absinthe
- #remote-other
- #otp
- #plug
- #how-to-question
- #macros
- #postgres
- #channels
- #elixirconf
- #exunit
- #discussion
- #code-sync
- #javascript
- #podcasts
- #onsite
- #dialyzer
- #docker
- #authentication
- #umbrella
- #full-time-contract
- #podcasts-by-brainlid
- #ecto-query
- #elixir-ls
- #phoenix_html
- #iex
- #blog-post
- #graphql
- #genstage
- #ai
- #websockets
- #supervisor
- #advent-of-code
- #elixirconf-us
- #distillery
- #processes
- #forms
- #api
- #metaprogramming
- #security
- #performance
Our Sponsors

Build Elixir applications with speed and confidence.

Supporting innovation across the BEAM ecosystem.

We build reliable cloud platforms for business-critical systems.

Catch errors, track performance, monitor hosts and more.

Error tracking for Elixir devs who love to ship. Start your free account.

Develop your skills with books, videos, and courses.

Enabling companies to succeed by building software people love.

The deployment platform built for Elixir: PaaS ease, VPS control.

The team behind Membrane, Popcorn, LiveDebugger. Available for hire.

Courses that'll move you from confusion to "Aha, now I get it!"