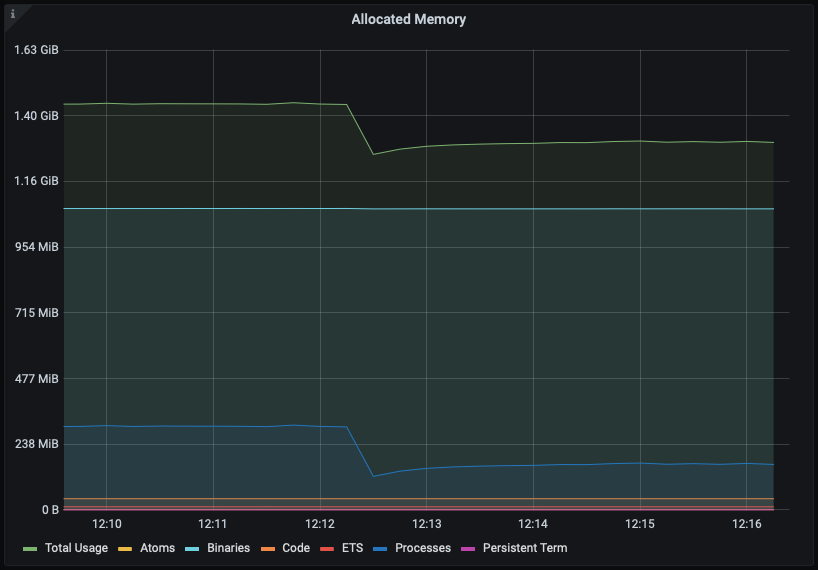
I have a node running in production. This node exhibits increasing memory usage, as can best be seen in this Grafana graph from the PromEx Beam Plugins Dashboard:
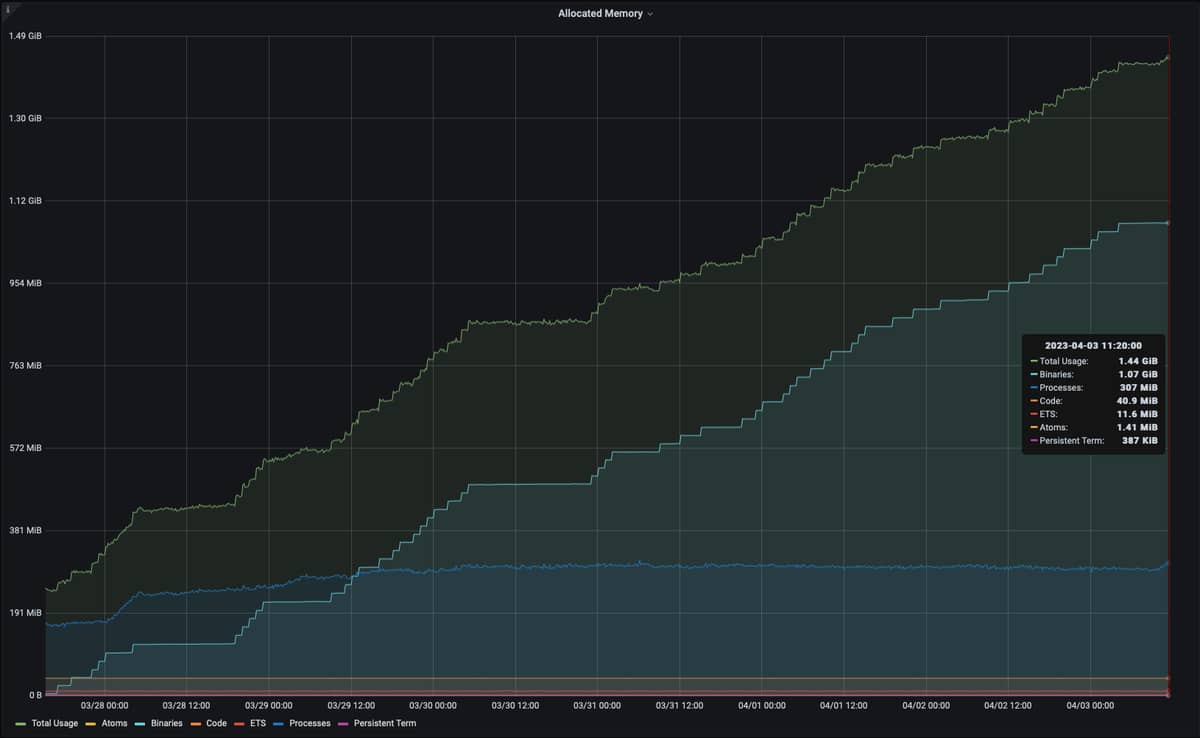
As you can see from the Grafana chart the increasing binary memory is the problem. What we see in the graph matches :erlang.memory(:binary):
# total memory used in MiB for the global binaries heap (i.e. for refc binaries) according to `:erlang.memory/1`
iex(name@node)1> :erlang.memory(:binary) |> Kernel./(2**20) |> Float.round(2)
1094.09
To find the culprit for the increasing memory usage I tried the special `binary_memory` item from `recon` as well as `bin_vheap_size` and `bin_old_vheap_size` from `garbage_collection_info`, aggregated over all processes:
# sum of binary_memory of all processes in MiB according to :recon.info(pid, :binary_memory)
# :recon.info(pid, :binary_memory) just calls :erlang.process_info(pid, :binary) and aggregates over the returned sizes
iex(name@node)2> Process.list() |> Enum.reduce(0, fn pid, acc -> :recon.info(pid, :binary_memory) |> elem(1) |> Kernel.+(acc) end) |> Kernel./(2**20) |> Float.round(2)
8.09

# size in MiB of unique off-heap binaries referenced from the process heap, aggregated over all processes
iex(name@node)3> Process.list |> Enum.map(&:erlang.process_info(&1, :garbage_collection_info)) |> Enum.reduce(0, fn {_, info}, acc -> Keyword.get(info, :bin_vheap_size) + acc end) |> Kernel.*(:erlang.system_info(:wordsize)) |>  Kernel./(2**20) |> Float.round(2)
0.63

# size in MiB of unique off-heap binaries referenced from the process old heap, aggregated over all processes
iex(name@node)4> Process.list |> Enum.map(&:erlang.process_info(&1, :garbage_collection_info)) |> Enum.reduce(0, fn {_, info}, acc -> Keyword.get(info, :bin_old_vheap_size) + acc end) |> Kernel.*(:erlang.system_info(:wordsize)) |> Kernel./(2**20) |> Float.round(2)
5.06
The idea was to dig deeper into processes that consume a lot of memory. But already the aggregates are two to three orders of magnitude smaller than the binary numbers from :erlang.memory(), so I have no idea where the memory is going.
I am looking for any ideas on how to debug this further, namely to find out where the memory for binaries is consumed.