Increasing resource usage with Phoenix

Hey, I am using Phoenix for a still quite small app. All the app does is getting some input, then starting a bunch of processes per entity and after a certain time, stopping these processes again (DynamicSupervisor).

We are not live yet, so the system is most of the time in “idle” mode, except a few times a week when the customer is testing some stuff.

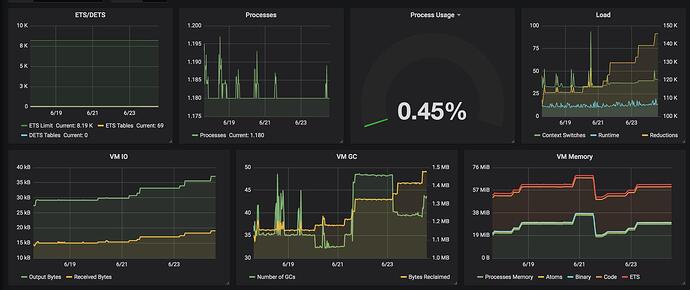
I am monitoring the application with Prometheus and noticed some increase in resource usage over time. You can see the BEAM dashboard in the provided screenshot. It shows the last 7 days. The resource usage goes up over time. I redeployed one time, that’s when the usage goes straight down.

For the memory part, it is mostly process memory that increases. It cannot be my processes since they get cleaned up if an entity is not “tracked” anymore.
It’s weird that the IO, GC and Load also increases.

While typing this, I may have an idea of what it could be. The Prometheus metrics are filling up over time, for example when bots hit URLs that don’t exist. But the Prometheus package stores the data in ETS and the ETS memory stays at around 1,9mb the whole time while process memory goes from 12mb to 33mb.

Just noticed that the process memory dropped to around 15mb overnight (screenshot is from yesterday), while all other metrics stayed high.

I am really confused about what’s going on here.

Quick summary of my setup:

  • Phoenix 1.4
  • Using DynamicSupervisor to start and terminate “tracking” processes
  • No real load on the system yet
  • Hackney pool size of 1000
  • prometheus_ex package for collecting metrics

1 Like

is this running as a “release” eg distillery etc ?

also I notice reductions are up… so I assume “work in progress” memory usage is also up - eg. you are processing more data/it’s taking longer time - so memory is released at a slower pace…

Oh sorry, forgot to say that I am using mix phx.server for now.

My part of the system (the DynamicSupervisor and friends) aren’t doing anything most of the time since the system is used very rarely at the moment.

The graphs indicate the memory is primarily allocated to processes - have you explored which processes use that memory? You could obtain the top offenders either with observer or some other tool (with recon, e.g. :recon.proc_count(:memory, 10))

2 Likes

Since I am using mix phx.server inside a Docker container, I cannot execute code in the context of the running application right now. I do plan to switch to releases tho. But it will take some days to have it filled up again before I can inspect it.

Debugging a system without a way to inspect that system is kind of a lost cause :wink:

You could potentially try some of the web-based observer replacements, but YMMV.

5 Likes

Haha, I know. I was just too lazy to setup the proper release. The project started as a technical POC to show its benefits and now I am preparing it for the real world.

EDIT: I just started setting up Distillery. Then in a few days I can investigate what’s going on.

Building the release locally works fine, but building it inside a container using bitwalker/alpine-elixir:1.8.1 errors with the following:

==> Generating start_erl.data
==> Generating vm.args from rel/vm.args
==> Generating sys.config from config/config.exs
==> Including ERTS 10.3.5 from /usr/lib/erlang/erts-10.3.5
==> Generating boot scripts
==> Release failed, during .boot generation:
        Undefined applications: [observer,wx]

I am mainly following https://hexdocs.pm/distillery/guides/working_with_docker.html with some adjustments.

As docker usually doesn’t have a graphical display server running, most erlang images (especially those that target small image sizes) strip out wx and dependants. So you either need to install a version of erlang that includes wx and other missing applications, choose another base image that has them already, or drop them from your :extra_applications.

2 Likes

Ah, I understand. I dropped them for now. Locally I am using iex anyway. Just thought it won’t hurt to have it in the release too.

So, having it running for quite some time now, I saw memory usage go up and then suddenly go down again. GC goes a little bit crazy but I don’t think that I should worry about it. IO goes up over time but I guess that’s just the /metrics endpoint serving more stuff.

What I do not understand is that the Reductions keep increasing.

For the memory part, this are the top 10 processes. Nothing special there:

1> :recon.proc_count(:memory, 10)
[
  {#PID<0.1521.0>, 4119660,
   [
     :code_server,
     {:current_function, {:code_server, :loop, 1}},
     {:initial_call, {:erlang, :apply, 2}}
   ]},
  {#PID<0.1520.0>, 1577780,
   [
     :kernel_sup,
     {:current_function, {:gen_server, :loop, 7}},
     {:initial_call, {:proc_lib, :init_p, 5}}
   ]},
  {#PID<0.1741.0>, 1159136,
   [
     current_function: {:gen_server, :loop, 7},
     initial_call: {:proc_lib, :init_p, 5}
   ]},
  {#PID<0.9.0>, 689524,
   [
     :erl_prim_loader,
     {:current_function, {:erl_prim_loader, :loop, 3}},
     {:initial_call, {:erlang, :apply, 2}}
   ]},
  {#PID<0.1683.0>, 426596,
   [
     :prometheus_sup,
     {:current_function, {:gen_server, :loop, 7}},
     {:initial_call, {:proc_lib, :init_p, 5}}
   ]},
  {#PID<0.1514.0>, 319328,
   [
     :application_controller,
     {:current_function, {:gen_server, :loop, 7}},
     {:initial_call, {:erlang, :apply, 2}}
   ]},
  {#PID<0.1692.0>, 88620,
   [
     :release_handler,
     {:current_function, {:gen_server, :loop, 7}},
     {:initial_call, {:proc_lib, :init_p, 5}}
   ]},
  {#PID<0.1677.0>, 29628,
   [
     :hackney_manager,
     {:current_function, {:gen_server, :loop, 7}},
     {:initial_call, {:proc_lib, :init_p, 5}}
   ]},
  {#PID<0.2790.0>, 26656,
   [
     :inet_gethost_native,
     {:current_function, {:inet_gethost_native, :main_loop, 1}},
     {:initial_call, {:inet_gethost_native, :server_init, 2}}
   ]},
  {#PID<0.1611.0>, 26580,
   [
     :tls_connection_sup,
     {:current_function, {:gen_server, :loop, 7}},
     {:initial_call, {:proc_lib, :init_p, 5}}
   ]}
]

The reductions is just the amount of times a function was called in a process, so it should always be climbing on long lived processes. :slight_smile:

But in my case, the tracking processes are started and later stopped. In the screenshot above, on the Processes graph, there you can see some spikes. That’s when tracking processes were started. But the Reductions increase all the time and the graph doesn’t show the total amount of recorded reductions but uses irate(). So the amount of active reductions also keeps increasing. It actually has very close similarities to the IO and Bytes Reclaimed graphs.

I wonder if it’s really just the metrics endpoint that fills up with more and more data (due to bots hitting 404 routes every now and then) and therefore creates load.