Is it possible to debug which processes and code places are using the DB pool when using Ecto?

Hi,

We have a regular Phoenix project using Ecto and Postgresql. But recently we are seeing a lot of connection timeouts or idle/closed connections. All looks like problem that DB pool is exhausted. Traffic has been pretty low, queries look ok, no big queries running all the time, no big Oban jobs. But I’m pretty sure we’re missing something.

So is it possible to debug which processes and code places are using the DB pool? Thanks to telemetry, we’re able to run code when these errors occur, but the question is whether it’s possible to get details about pool usage.

Telemetry handler:

 def handle_event(
        [:enaia, :repo, :query],
        measurements,
        %{result: {:error, %DBConnection.ConnectionError{} = error}} = metadata,
        _config
      ) do
   # check and log details about Pool usage
 end 

I can get repo’s child, but I’m not sure how to proceed.

repo_pid = Process.whereis(MyApp.Repo)
children = Supervisor.which_children(repo_pid)
1 Like

First step is to see your data for queue times, query times, and idle times, as those will show how busy the pool is. Also, what do you mean by connection timeouts?

The idle/closed connections may happen if the database or a proxy are closing them and are not necessarily an indicator of a problem (although we do ping the connection every second).

2 Likes

We get these errors:

 (DBConnection.ConnectionError) tcp recv (idle): closed
** (DBConnection.ConnectionError) connection not available and request was dropped from queue after 843ms. This means requests are coming in and your connection pool cannot serve them fast enough. You can address this by:

  1. Ensuring your database is available and that you can connect to it
  2. Tracking down slow queries and making sure they are running fast enough
  3. Increasing the pool_size (although this increases resource consumption)
  4. Allowing requests to wait longer by increasing :queue_target and :queue_interval

See DBConnection.start_link/2 for more information
** (DBConnection.ConnectionError) connection not available and request was dropped from queue after 2084ms. This means requests are coming in and your connection pool cannot serve them fast enough. You can address this by:

  1. Ensuring your database is available and that you can connect to it
  2. Tracking down slow queries and making sure they are running fast enough
  3. Increasing the pool_size (although this increases resource consumption)
  4. Allowing requests to wait longer by increasing :queue_target and :queue_interval

See DBConnection.start_link/2 for more information

how you can see, waiting time in queue is wild. Sometime it’s in hundreds and sometimes thousands of ms.

Our configuration:

  • pool_size: 29
  • timeout: 60_000

Other than that is as default. Bigger timeout is because sometimes per day we run some long running queries. But these were not running at that time.

Database is running on Fly in cluster of 3 machines with size performance-8x-cpu@16384MB. App itself it doesn’t do big stuff. At that time when this happen last time a few hours ago we had max 20 users online and we were doing some background jobs. See stats from AppSignal.
Issue happen at 7:48am, you can see that ~10 minutes before we have “bigger” traffic than in time crash happen.

see peak before

what do you suggest to track when this error happen to help us to remove these errors?

Really thank you for you time.

In this case there is something overloaded in the system. I would follow the suggestions in the message, in particular tracking queue_time and query_time, both in telemetry events, finding slow queries in the database, or checking if the machine is overloaded, by measuring the run queues or the machine cpu/memory stats. :slight_smile:

From fly dashboard only this shows some kind of peak, other metrics are consistents:

So basically machine is not overloaded when this event happen, both app and database to be correct. When this event happen we have some struggles with DB immediately after “pool is overloaded”. It means that pool is fully used, but it feels more like some pools are “abandoned”. I mean no big queries are running, most of queries went to ConnectionError and database start closing pools. Sometimes this even mean that master machine goes to zombie mode and new master has to be elected. Election happen but zombie has to be cleaned manually.

So question is, when I will have query_time and queue_time. I’m pretty sure that queue_ time will be long, but query_time first regular, later bigger. At least that execution time in AppSignal looks like, graph went up when this even happen.

My goal was to see what is using all pool connections when error happen, when query is timeout because it’s waiting too long in pool. But I think it’s not so simple how I expected.

Also when I add custom metric to every ecto query which we track in AppSignal, it will not help us, because it will be hard to identify as problematic query. We see execution time, so adding query_time will tell us that it was not affected by full pool, but execution time can be affected by event or primary cause.

I will try to select all queries around the event and see execution time and see slow queries. But we have not seen anything big there.

Other things that could be helpful:

  1. Investigate if this relates to deployments somehow

  2. Chart p90% and p99% not averages, especially for queue and query times, but you should be able to track queries that take too long. Even if by using custom telemetry handlers. If anything takes more than a second, make sure to log that

1 Like

We will soon release where we will track these numbers on own dashboard and per every sample.
Code from custom telemetry handler for better reference:

...
 :telemetry.attach(
      {__MODULE__, [:enaia, :repo, :query]},
      [:enaia, :repo, :query],
      &__MODULE__.handle_event_track_query/4,
      nil
    )
....

def handle_event_track_query([:enaia, :repo, :query], measurements, metadata, _config) do
    current_span = Tracer.current_span() || Tracer.root_span()

    [:idle_time, :query_time, :decode_time, :total_time, :queue_time]
    |> Enum.each(fn m ->
      log_measurement(measurements, m, "ecto", current_span)
    end)

    maybe_log_connection_error(current_span, metadata)
  end

efp log_measurement(measurements, name, prefix, span) do
    case Map.get(measurements, name) do
      nil ->
        nil

      value ->
        value = System.convert_time_unit(value, :native, :millisecond)

        log_name = "#{prefix}.#{name}"

        Appsignal.add_distribution_value(log_name, value)
        span_set_attribute(span, log_name, value)
    end
  end

  defp maybe_log_connection_error(span, %{
         result: {:error, %DBConnection.ConnectionError{reason: :error, message: message}}
       }) do
    Appsignal.increment_counter("ecto.connection_error", 1)
    span_set_attribute(span, "ecto.connection_error", message)
  end

  defp maybe_log_connection_error(span, %{
         result: {:error, %DBConnection.ConnectionError{reason: :queue_timeout, message: message}}
       }) do
    Appsignal.increment_counter("ecto.queue_timeout", 1)
    span_set_attribute(span, "ecto.queue_timeout", message)
  end

  defp maybe_log_connection_error(_, _), do: :ok

Hope it will clarify behaviour of our app or database.

We had two small incidents meanwhile. No big queries were executed based on telemetry.
But we had some long running Oban jobs but based on telemetry they were long because 3rd party api response was super slow. But that should not affect DB pool, because only output is stored in DB and no db transaction is called around that api call. But maybe it could affect network, but…

I was going to ask if you were on Fly and read the post above. The follow up question is: are you using fly postgres? If so, something similar happened to me a few weeks ago. In my case it was that one of the machines (I have 3 for the db like they suggest) for no reason crashed and was stuck in a boot loop, never becoming available completely. I was looking at connections like you were, I’d see the same errors. After contacting support, they mentioned the bad machine and, they were correct! You can see it in the dashboard, 2/3 healthy machines. I’m not sure this is your problem, but it was for me. In case it is, I have some notes on how to fix it and can share, hope this helps.

We already have had this issue with crashed primary machine multiple times this week, we changed machine with more resources maybe a week ago. so it’s new machine. In case this is the issue, something has to broke that machine even with new ones

1 Like

I’m not sure this is your problem, but it was for me. In case it is, I have some notes on how to fix it and can share, hope this helps.

please share it, maybe it will help us to see our problem. Thanks

We already have had this issue

Hmm, interesting.

Please share

Absolutely, here are the steps (if it doesn’t help you, maybe it will help someone else):

# Steps to destroy a bad machine (and volume) and clone a good one - fly postgres
# list the machines, get the id for the bad one
$ fly machine list --app <your_db_app>

# list the volumes, get the volume attached to the bad one
$ fly volumes list --app <your_db_app>

# had to use --force, cli suggested, worked
$ fly machine destroy <bad_machine_id> --force --app <your_db_app>

$ fly volumes destroy <bad_volume_id> --app <your_db_app>

$ fly volumes list --app <your_db_app>
$ fly machine clone <good_machine_id> --region <target_region> --app <your_db_app>

# confirm
$ fly volumes list --app <your_db_app>
$ fly machine list --app <your_db_app>

One of the things support said was to make sure the machine you cloned was a good one. Could it be you cloned a bad one?

I feel like I’m pulling you into a rabbit hole, sorry about that, but I’ve had to do this twice now (that’s why I had notes :joy:)

Have you reached out to Fly’s support?

1 Like

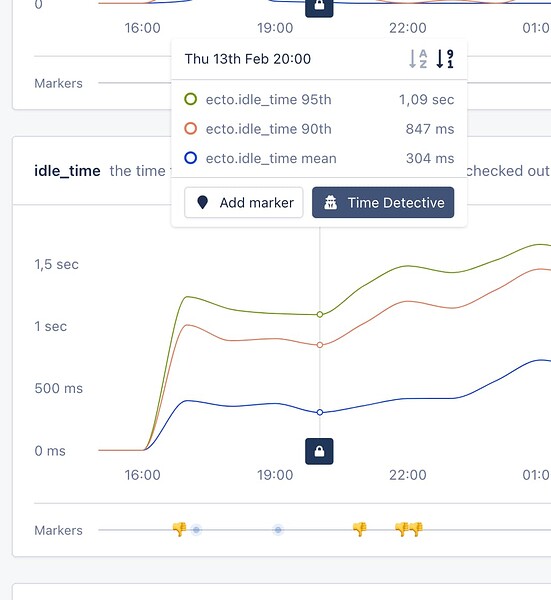
I added these values to telemetry and look on this dashboard. :-1: are our crashes, dots on timeline are releases.

All looks ok but:

  • idle time is too big, not sure why or if it’s ok
  • total time - it’s too low, I expected it and sum of all other metrics

1 Like

I found nice explanation in other post

tl;dr the idle time is how long a connection was ready and enqueued in the connection pool waiting to be checked out by a process. Therefore we can be happy to see it above 0.

idle time is recorded to show how busy or not busy the connection pool is. During connection pool IO overload the idle time will be as close to 0 as it can be, not counting message passing overhead, because then the connections are always in use by processes running transactions/queries. If a connection is not immediately available there is queue time that is the time between when the request for a connection was sent and when a connection becomes available. This time has latency impact for processes running transaction/queries as they need to wait for a connection before they can perform a query because the connection pool does not have enough capacity. db time is the time spent holding onto to the connection, i.e. time spent actually using the database. Therefore the latency for the calling process is queue time plus db time.

When the connection pool has extra capacity the queue time should always be as close 0 as it can be because a connection is available when requested. Only once the transaction rate is beyond what the connection pool can handle does the queue time increase. However that is a little late because latency is already impacted once it goes above ~0. idle allows us to see how close to having queue time, the higher the idle time the more capacity we have in the connection pool.

Perhaps a clearer way to think about it is if you see an idle timeout of 100ms, that means we could have run 100ms worth of db time on that connection since the last time that connection was used. So to be as efficient as possible on resource we would want queue and idle to both be near 0. However because of the latency impact of queue, we should be happy to sacrifice some idle time to keep queue at 0 when possible.

Of course we can make queue time move to 0 by increasing the pool size. However if the pool is too large db time will suffer as the database becomes the bottleneck instead of the connection pool.

If the application is not sending any queries for a prologued interval and then sends a query why is the idle time capped? This occurs because idle connections periodically send a ping message to the database to try to ensure connectivity so that the connections are ready and live when needed, and we don’t need to attempt to connect when a query comes in. If we needed to reconnect then the database handshake time would add latency to the transaction/query being processed. The ping message resets the idle timer because an individual connection is unavailable from the pool during a ping. If it was left in the pool the connection would be blocked waiting for a pong response and incur a wait on the connection like just like a handshake. Pings are randomized to prevent all connection becoming busy at the same time.

So basically it can means that we have too big pool size and we fire too much pressure on DB and our connection pool basically do not handle pressure correctly.
That can explain peaks where we have more queries. Like here

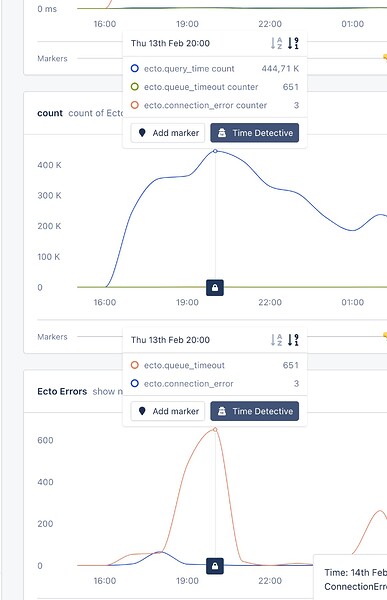
When we had 444k ecto queries and 651 DBConnection.ConnectionError timeouts. And idle time was 1sec for 95P or 305ms mean. Queue time was 6ms.

So if i’m not wrong, reducing pool size we should move pressure from DB to our DBConnection Pool (“Ecto”) which should handle pressure more effective. Right?

1 Like