I found nice explanation in other post
tl;dr the
idletime is how long a connection was ready and enqueued in the connection pool waiting to be checked out by a process. Therefore we can be happy to see it above0.
idletime is recorded to show how busy or not busy the connection pool is. During connection pool IO overload the idle time will be as close to0as it can be, not counting message passing overhead, because then the connections are always in use by processes running transactions/queries. If a connection is not immediately available there isqueuetime that is the time between when the request for a connection was sent and when a connection becomes available. This time has latency impact for processes running transaction/queries as they need to wait for a connection before they can perform a query because the connection pool does not have enough capacity.dbtime is the time spent holding onto to the connection, i.e. time spent actually using the database. Therefore the latency for the calling process isqueuetime plusdbtime.
When the connection pool has extra capacity the
queuetime should always be as close0as it can be because a connection is available when requested. Only once the transaction rate is beyond what the connection pool can handle does thequeuetime increase. However that is a little late because latency is already impacted once it goes above ~0.idleallows us to see how close to havingqueuetime, the higher theidletime the more capacity we have in the connection pool.
Perhaps a clearer way to think about it is if you see an
idletimeout of 100ms, that means we could have run 100ms worth ofdbtime on that connection since the last time that connection was used. So to be as efficient as possible on resource we would wantqueueandidleto both be near0. However because of the latency impact ofqueue, we should be happy to sacrifice someidletime to keepqueueat0when possible.
Of course we can make
queuetime move to0by increasing the pool size. However if the pool is too largedbtime will suffer as the database becomes the bottleneck instead of the connection pool.
If the application is not sending any queries for a prologued interval and then sends a query why is the
idletime capped? This occurs because idle connections periodically send a ping message to the database to try to ensure connectivity so that the connections are ready and live when needed, and we don’t need to attempt to connect when a query comes in. If we needed to reconnect then the database handshake time would add latency to the transaction/query being processed. The ping message resets the idle timer because an individual connection is unavailable from the pool during a ping. If it was left in the pool the connection would be blocked waiting for a pong response and incur a wait on the connection like just like a handshake. Pings are randomized to prevent all connection becoming busy at the same time.
So basically it can means that we have too big pool size and we fire too much pressure on DB and our connection pool basically do not handle pressure correctly.
That can explain peaks where we have more queries. Like here
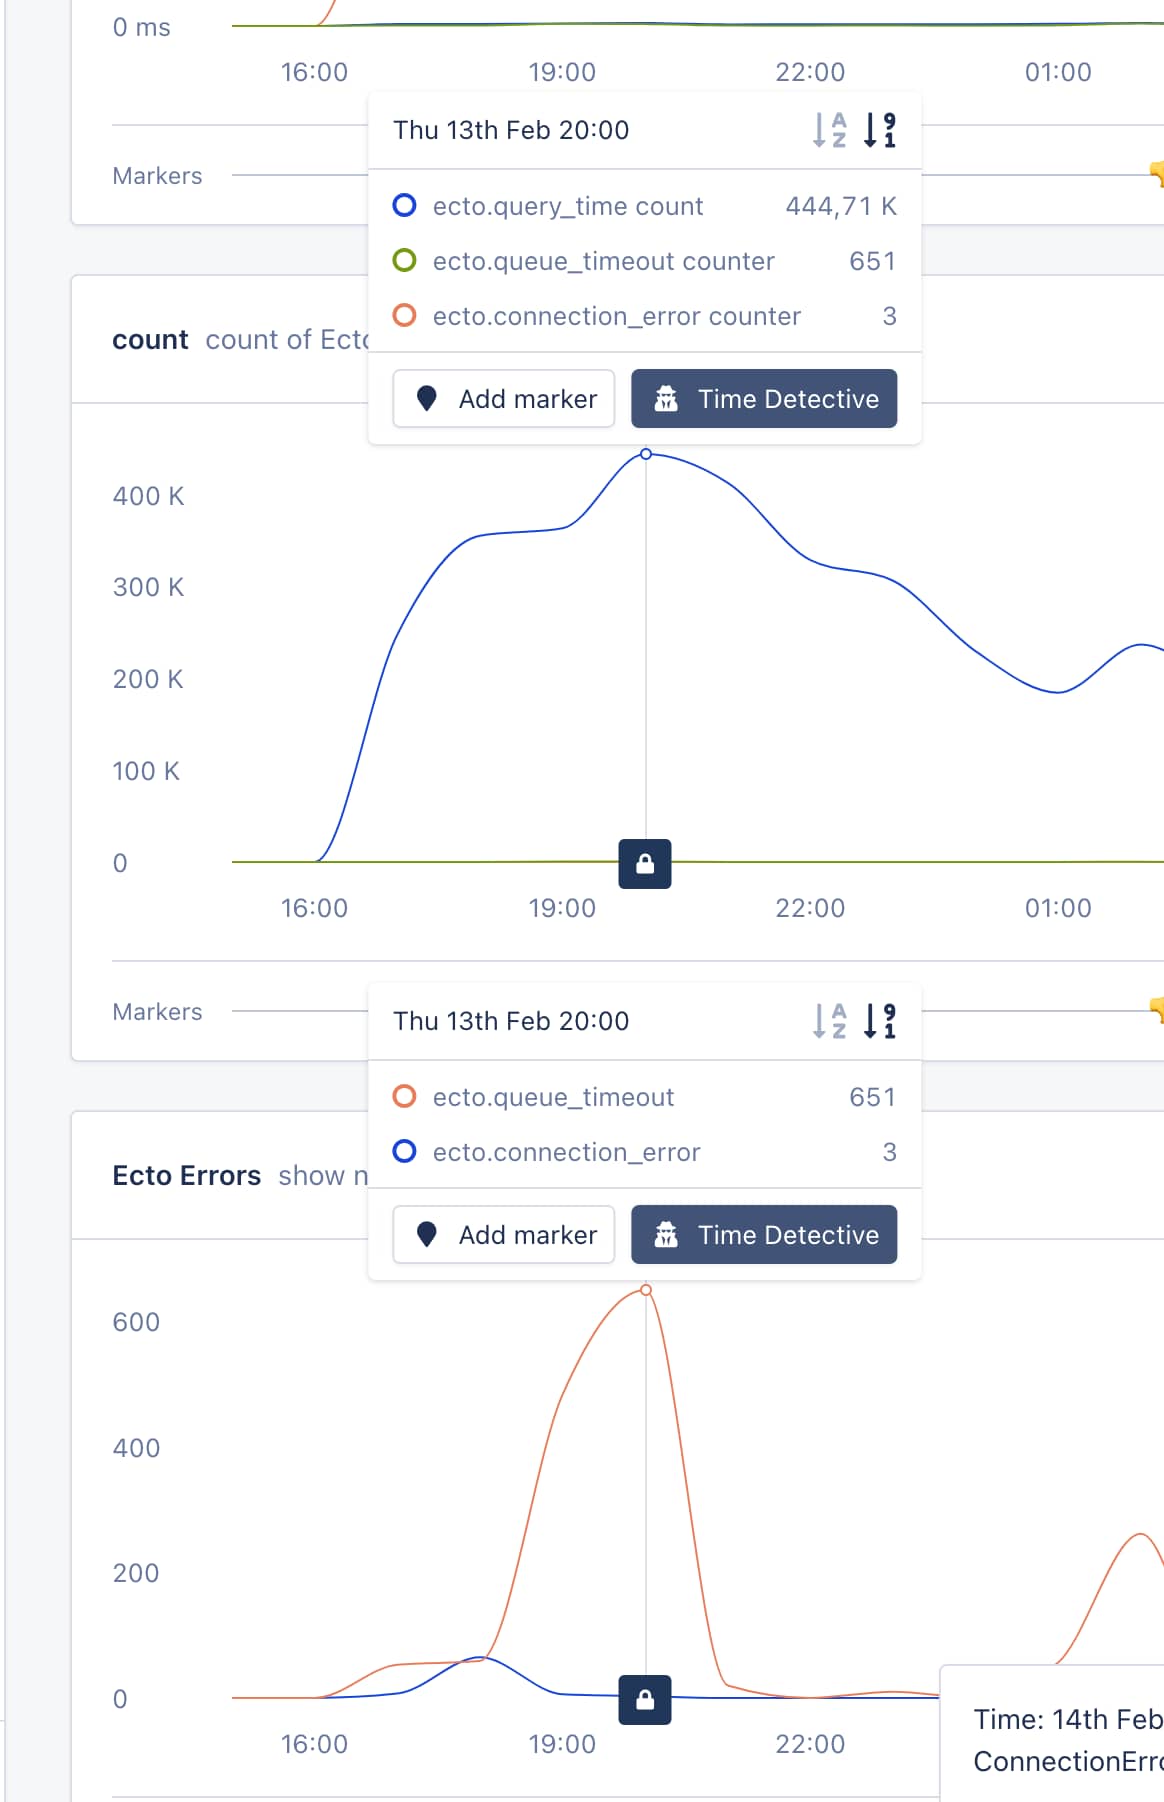
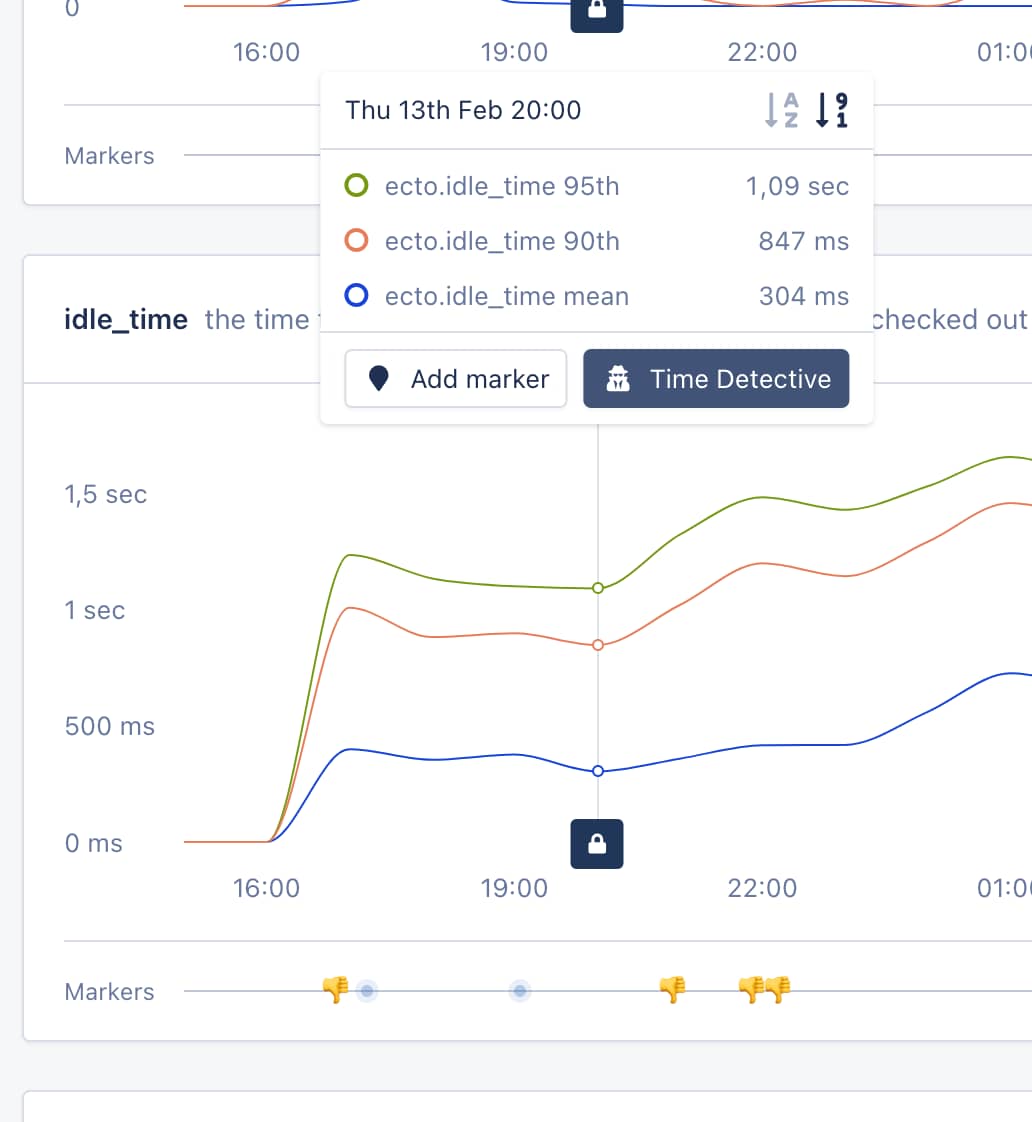
When we had 444k ecto queries and 651 DBConnection.ConnectionError timeouts. And idle time was 1sec for 95P or 305ms mean. Queue time was 6ms.
So if i’m not wrong, reducing pool size we should move pressure from DB to our DBConnection Pool (“Ecto”) which should handle pressure more effective. Right?


