K8s OOMKilled pods

Hey. Been searching the interwebs and the forums, but don’t seem to find an answer to this problem.

Our service runs several pods in a kubernetes cluster. They are a bit memory hungry, each limited to 1,7 GB of k8s memory. It seems I may have to increase this again, but of course this prevents horizontal scaling. Every now and then k8s kills our pods with OOMKilled.

My gut feeling is that our erlang/elixir/phoenix application does not need this much memory, it just does not know about the memory limits. OOMKilled typically happens when a pod tries to hog more memory than is assigned.

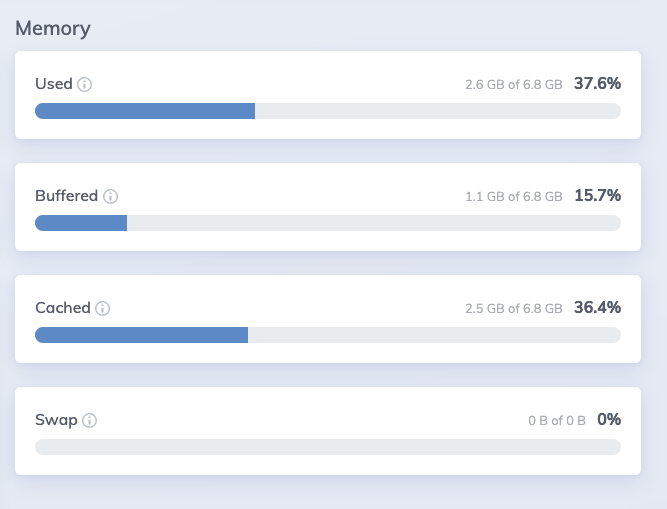
Looking at phoenix live dashboard, it at least it shows the app thinks it has the entire node’s memory accessible.

What should we do? Is there a way to tell beam not to use more memory thank 1,7 GB, or is there a setting where beam reads the k8s memory limits? Or is there some other solution?

2 Likes

I had similar issues and would be interested to find a solution, but I didn’t find such flag.

In fact, figuring out which processes were even responsible for allocating memory was difficult on BEAM.

I ended up sampling the state of the system every 30s or so and be warned if we detect a process that exceeds something like 15 MB of memory.

The code I’m using is something like:

defmodule Infra.Bloat.Find do                                                                                                                                            
  @info_keys [                                                                                                                                                           
    :current_function,                                                                                                                                                   
    :initial_call,                                                                                                                                                       
    :status,                                                                                                                                                             
    :message_queue_len,                                                                                                                                                  
    :links,                                                                                                                                                              
    :dictionary,                                                                                                                                                         
    :trap_exit,                                                                                                                                                          
    :error_handler,                                                                                                                                                      
    :priority,                                                                                                                                                           
    :group_leader,                                                                                                                                                       
    :total_heap_size,                                                                                                                                                    
    :heap_size,                                                                                                                                                          
    :stack_size,                                                                                                                                                         
    :reductions,                                                                                                                                                         
    :garbage_collection,                                                                                                                                                 
    :suspending,                                                                                                                                                         
    :memory                                                                                                                                                              
  ]                                                                                                                                                                      
                                                                                                                                                                         
  @fifteen_megs 1024 * 1024 * 15                                                                                                                                         
                                                                                                                                                                         
  def processes do                                                                                                                                                       
    Process.list()                                                                                                                                                       
    |> Enum.map(fn pid ->                                                                                                                                                
      Process.info(pid, @info_keys)                                                                                                                                      
    end)                                                                                                                                                                 
    |> Enum.filter(&(&1[:memory] && &1[:memory] >= @fifteen_megs
  end           
end

I run Infra.Bloat.Find every 30s and log if something was found. Then, I look at the logs and if something showed up I fix the memory leak.

The usual suspects, according to my experience are:

  • long running GenServers that do very little work, preventing GC from kicking in. Suspending these processes when idle does the job here.
  • Absinthe GraphQL resolvers that were written in naive way, basically exploding the returned size of the payload and / or doing a lot of N+1 queries. Data loader / and / or adding pagination to these helps a lot.
  • processing uploaded files, and/or processing JSON. I ended up writing a pretty shitty streaming subset of JSON parser because of the API I’m using tends to return super large arrays of things in JSON and this was crashing the system easily.

With GraphQL resolvers or just a web requests that are crashing your pod, you need to know that BEAM is able to allocate a lot of memory very very fast, so you won’t catch all of such spikes. Some will kill your pod, others won’t but will go unnoticed, so I ended up just running the sampling code constantly on production and making sure nothing new exceeds the arbitrary memory limit I’ve set up. This seems to work really well at scale and I am able to detect memory leak issues before they are the problem.
12 Likes

In the case of the JSON, there is a good thread about this.

3 Likes

What version of Erlang are you running?

Before Erlang 23.0 the Erlang VM wasn’t container aware, meaning they didn’t respect the memory limits applied by k8s.

This is worth a read Kubernetes | Adopting Erlang

3 Likes

We were running erlang:23-alpine, but switched over to elixir:1.12.0-alpine today, which i belive is based on OTP 24 (latest).

This weekend we had around 40 OOMKilled pods, and today I believe I have only seen it once. So maybe it has improved even with OTP 24. However we have deployed many times today, so maybe the pods just need a little time. Will monitor and report back.

Thanks for the article.

@hubertlepicki thanks a lot for your code. I have been watching processes in LiveDashboard, but this of course automates that.

2 Likes

Do you happen to know if this also applied to cgroups directly? For example if you weren’t using containers but had a Phoenix app managed with systemd and used systemd to limit resources would it also be ignored?

As BEAM is process-oriented you can set a per-process memory limit. By default, no process has a memory limit and they are all allowed to consume as much as they want.

You can change that default though. E.g. to change the limit to a reasonable 10MB if you’re launching your instance from a shell script add the export ELIXIR_ERL_OPTIONS:

export ELIXIR_ERL_OPTIONS="+hmax 10000000"
iex -S mix

Or if you’re using a release put that into your rel/vm.args.eex

+hmax 10000000

In addition to that, it’s possible to change the max process memory on a per-process level. So you can go with a default limit of 10MB per process as above but then increase that for certain “important” processes, or reduce it for less important processes.

Also, you could stay without a global default limit but set a per request limit from an embedded plug. For E.g. adding this to the beginning of your endpoint definition would set all phoenix request memory limits to 1MB:

defmodule BuzzWeb.Endpoint do
  use Phoenix.Endpoint, otp_app: :buzz

  # Setting request memory limit
  plug :set_memory_limit
  defp set_memory_limit(conn, _opts) do
    :erlang.process_flag(:max_heap_size, 1_000_000)
    conn
  end

If you’re using liveview this does not affect the liveview processes as they don’t run through these endpoint plugs. In that case, you could do it from the mount callback or similar.

Hope this helps.
Cheers!

6 Likes

I don’t unfortunately, I only ever had experience with k8s, but if it’s using cgroups under the hood, I would imagine it would be applicable.

Yeah, I found my spikes by just running that code at intervals in prod, otherwise in livedashboard I would not see the spikes on the charts and it’s also difficult to catch these things in processes page on livedashboard as well, esp. if it’s a quick request that allocates a lot of memory. I didn’t find a good way to detect every single occurence of the situation, but many samples at a large time span did the job.

2 Likes

A book suggestion on this topic is Erlang in Anger. It’s free and is one of the best resources that I read to understand what things can go wrong and how to diagnose them.

That said, one thing I might try in a high-memory situation is to force GC globally to see if the memory drops. I do this with Process.list() |> Enum.each(& :erlang.garbage_collect/1). If you do see a large memory drop, then you may have a “memory leak”. But it may not be a memory leak like you’re used to where there’s unfreed memory, but rather processes that don’t have the opportunity to GC due to the lifecycle of the BEAM. One thing you can do to give the opportunity to GC more frequently is to set the VM flag of -env ERL_FULLSWEEP_AFTER 20 in your VM.args file.

I set the above flag in every Elixir app I build now. I have not seen any negative side effects from it (can increase CPU usage, but I did not see a noticeable change) and the benefits can be significant in some long-lived processes.

I wrote an old post about how I diagnosed this in one of my services. The post itself is irrelevant because Phoenix Channels hibernate by default now, but the content itself is still relevant.

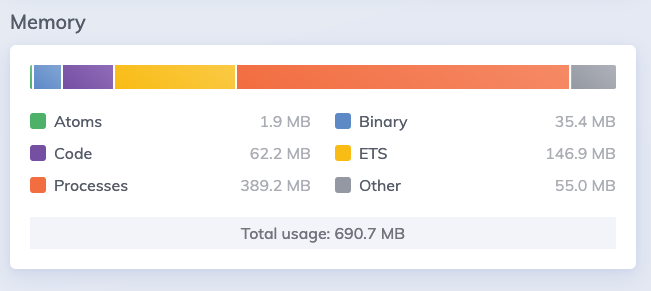
edit: 1 more question. What does your memory usage look like? There are several types of memory in the BEAM (process, binary, atom, etc) and that can determine the specific issue. I am not familiar with LiveDashboard as I have used observer_cli in my projects, but I imagine that’s one of the main breakdowns it provides.

7 Likes

Erlang/OTP 23 only gained awareness of the CPU restrictions set through container limits. The Erlang VM does not do anything with the knowledge about how much memory is available to it.

4 Likes

The forced GC is an approach we’ll definitely try, thanks for the tip and the link for the book.

After looking at our processes a bit, memory usage, I believe it is unfortunate usage of socket.assigns in LiveView which may be the culprit. It is definitely process memory which is to blame at least. We do have quite a bit of cached data, but that does not seem relevant at all (only about 80 MB).

I obviously don’t understand all the underpinnings of beam memory usage an allocation. So this is probably a very naive suggestion. But if beam thought accessible memory was only 1,7 GB, would it not try to GC before, i.e. chances of k8s OOMKilled should be reduced?

The way LiveDashboard reports memory is not obvious to me. The pod is restricted to 1,7 GB, but this is what it reports. So limiting it globally is maybe a bad idea, just a thought. k8s reports the pod is using only 566 MB at the moment.

image

Edit: the above image is most likely what beam sees as the OS usage, which is running several pods. I thought it maybe was what the beam process used, which would’ve been crazy.

First page of the LiveView dashboard reports on the current beam process. I.e.

image

We’ve deployed ERL_FULLSWEEP_AFTER, so fingers crossed.

And again, thanks for all tips, and suggested tools. The Elixir community is an amazing!

3 Likes

So I’ll caveat this with I’m well read on this but I don’t know the answer with certainty. My understanding is that because the beam does per process GC, it doesn’t base GC on the global memory pool.

I know this to be true: each process will (de)allocate memory as it crosses certain water marks, or if the number of reductions is hit (which by default is incredibly high, which is why I recommended reducing it). So what can happen is a process gets stuck where it has allocated memory a few times, and new memory requirements doesn’t put it past the water mark. So it gets stuck in the sense that it won’t trigger a major GC on the process. It’s not a normal memory leak, but it is the same end result. It is very application specific and so I can’t tell you if that’s what has happened here. If this flag I gave you helped, then it likely is what happened.

I don’t know if this is out of date, I think it’s recent though: Erlang Garbage Collector - Erlang Solutions

2 Likes

Thanks!! That answers the uncertainty I had there. Right from the expert.

1 Like

Oh, interesting, thank you for the information.

It is not the number of reductions used, but the number of minor GC cycles that has to happen without a fullsweep.

The FULLSWEEP_AFTER option is set very high because it is not meant to be the main reason of which a fullsweep happens. The main reason is supposed to be when the old heap is filled with data. However, as you have noticed, that heuristic does not always work and thus you have to resort to lowering the FULLSWEEP_AFTER flag or doing a manual GC of the afflicted processes.

The Erlang documentation has the same article though very slightly updated: Erlang -- Erlang Garbage Collector

4 Likes

Ah yes, good point.

I’ve been looking for info about the minor GC cycle but I’m struggling a bit. What causes the minor GC to occur? Does it happen after each message is processed?

1 Like

A minor GC happens when the young heap is full. Erlang -- Erlang Garbage Collector
A major GC happens when the oldheap is full or the FULLSWEEP_AFTER counter is triggered.

2 Likes

This turned into quite a few insights, at least for me. Thanks again for all your help and knowledge.

I don’t think there is an actual solution to this problem. So don’t think I will mark any answers as a solution. But at least I will summarize what we have done.

  • Deployed similar code to hubertlepicki suggestion, to monitor process memory usage over time. Gives us a chance to find processes hogging too much memory.
  • Added the ERL_FULLSWEEP_AFTER from sb8244, to trigger a full gc more often.
  • Considering setting a global max heap size, as suggested by dominicletz, but we will have to get more control before doing so.

A final change we’ve done. We are running our pods in prod now without a k8s limits memory setting, i.e. the pods may hog as much memory as they like. Baseline seems to be between 500-700 MB, which is ok. Every now and then a pod will allocate more than over 1,7 GB, but since the host has a bit of free memory, this should be ok. If a node starts to struggle k8s will kill the pods anyways.

Only been running this for a few hours, but no OOMKilled pods so far at least.

5 Likes