Environment
- Chart.js v3.9.1
- :phoenix, “~> 1.6.11”
- :phoenix_live_view, “~> 0.17.5”
- Elixir 1.13.4
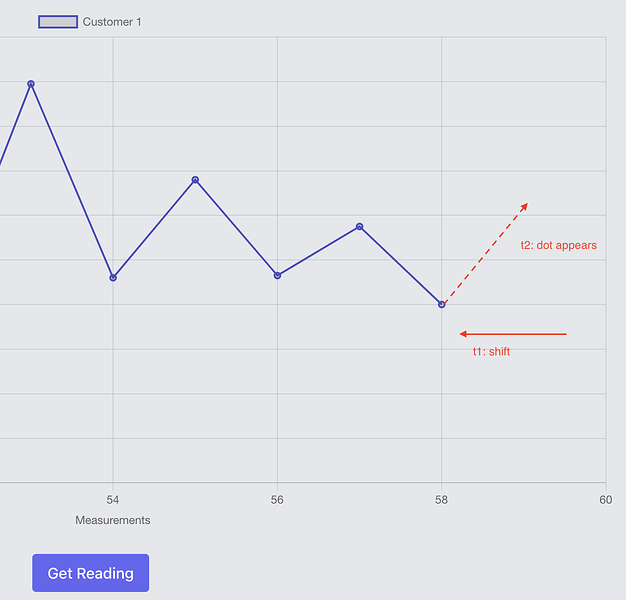
The picture above shows what I am working on. It is a line chart I have drawn with Chart.js the latest greatest.
First I describe the issue and then below I will describe what I am doing.
The Issue
When I click on the button to add a new dot, the diagram shifts to the left (*t1) and after a second (*t2) the new dot is shown. The delay is so big that if I schedule an automatic update of 1 second period, the diagram will start shifting but no dot will be added to the chart, ending up in an empty chart after all the dots are dropped on the left hand side.
Detailed description
You might be familiar with this example if you have done the “Phoenix LiveView” course from Pragmatic Studio.
Here it goes, when I click on the refresh button, Phoenix Live View will send an event to the client to add a new point to the chart.
push_event(socket, "new-point", point)
On the client, there is a JavaScript Hook that handles the event and adds a dot to the chart.
On the mount function a handler is hooked for adding new points.
        this.handleEvent("new-point", ({label, value}) => {
            this.chart.addPoint(label, value)
        })
The function that adds the point is below:
  addPoint(label, value) {
    const labels = this.chart.data.labels;
    const data = this.chart.data.datasets[0].data;

    labels.push(label);
    data.push(value);

    if (data.length > 12) {
      data.shift();
      labels.shift();
    }

    this.chart.update();
  }
I measured the addPoint function and it is executed in less than 8 milliseconds, I see the chart be shifted to the left and after approximately 1 second the new dot appears in the chart. I commented out the rest of the hooks I added for the other pages to make sure they did not interfere with the drawing, but I don’t know what is causing this delay.
In addition, the canvas is wrapped in a div so phoenix ignores rendering changes phx-update="ignore".
Where else this delay can come from?
Thank you!


