I have this live view that keeps hanging immediately after loading.
By hanging, it stops responding to incoming messages and eventually (I believe) the web browser times out and starts a new live view process. Because the PID - as output in the template increments.
Then either it comes good, or the cycle repeats.
I have put print messages on all the entry and exit points in more code, and I have also removed all interaction with other processes. I have confirmed that all my functions return immediately and without delay.
It seems to be more likely to occur on a local development environment then a deployed environment. Even with MIX_TARGET set to prod.
For what it’s worth, I experience this relatively consistently on development environment immediately after recompiling or first launching the server.
I navigate to a LiveView route, the initial render happens, and then for anywhere from a few to 10+ seconds, I’m unable to interact with the page as the NProgress bar displays, and the default LiveView behavior of somehow making buttons/links unclickable happens. Then finally the Live websocket connection is established, and I’m able to interact with the page.
At first, I thought “this is a pretty crummy UX; is this what my users will experience in prod?” But then over time I realized it only happens in dev.
Does anyone have insight on why this happens? Does this happen to others, or am I in a minority?
I see something like this with firefox when I reload a tab after the dev server restarted. It feels like some kind of progressive backoff baked in from the client side blocking the attempt to reconnect the websocket. A new tab works as expected.
I find that on all environments - even on prod, if I reload the page, the pid displayed on the page always changes exactly once before the page stabilizes. That is, click reload. pid changes to new temp pid. pid then changes to final pid, and everything works. It is fast, if I didn’t display the pid and watch the pager load very closely I wouldn’t notice.
Maybe this is completely 100% normal. But it seems weird, and unless somebody can give me a good reason, it makes me a little bit uneasy.
This is when I have <%= inspect(self()) %> inside my live view template.
Might try another app, see if the same thing happens or not.
I have seen two different failure modes. One where the entire page is totally unresponsive. This is annoying. But relatively rare and unusual. To such an extent I can’t be 100% sure of the symptoms right now.
The failure I was describing was slightly different. Only the process is unresponsive. As in if another process sends a cast message, that message never gets processed. But right now, not 100% convinced this isn’t related to Error: EMFILE: too many open files, watch - #6 by brianmay, which I fixed. I concluded yesterday that they were unrelated issues, but today I think I might have been confused.
I still see the dual pid on page load. But I suspect this might be a normal quick of page load, as I only see one live socket being used.
When you are talking about prod are you just building it in prod mode and still running it on localhost? Because problem I had in 2019 is related to localhost. See my previous reply into this thread, I added my findings from 2019 there. In short if you are using localhost try using 127.0.0.1 instead and see if problem persist.
This is normal. The first render is done as a static HTTP request, which is done in Pid<X>. Then the javascript connects via websocket, establishing Pid<Y> which does the live render.
I consistently have this issue in dev with firefox, has anyone figured out the root cause / how to resolve it, it is becoming a considerable time sink at this point.
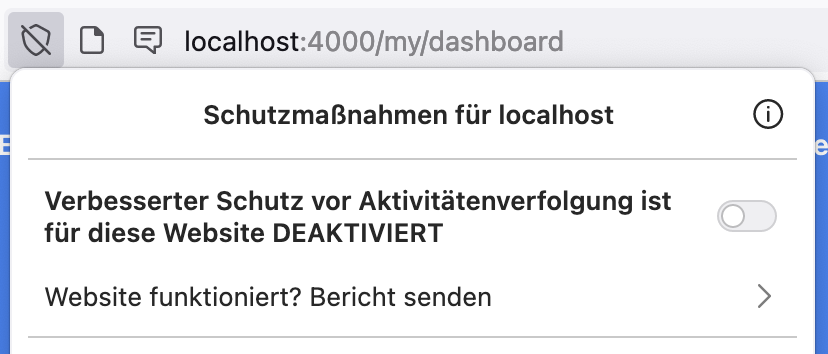
I’ll have to find the link later, but I read somewhere that Firefox has some security feature related to web socket connections that explained the behavior.
I was running into same issue.
In my case, logging in with the phx.auth generated live view login page did not work.
The backend handled the request immediately, but the browser was just “hanging”.