
praveenperera
Load testing: Struggling to get more than 50K-60K connections to a Phoenix Channel using Tsung
I’ve been trying load test of phoenix channels for an app I’ve been working on for a client. I’m using tsung to do so. I’m struggling to get more than 50K-60K connections at a time. I feel like I’m missing something simple, but I’ve been struggling with this for a while now.
EDIT: I also just tried it with a brand new phoenix project:
GitHub - praveenperera/bare_channel · GitHub
Here is my info:
Tsung setup:
Version: 1.6.0
5 worker nodes: DigitalOcean - 16GB 6vCPUs
1 controller node: DigitalOcean - 16GB 6vCPUs
Application server setup:
DigitalOcean - 8GB 4vCPUs also tried 16GB 6vCPUs
Elixir: 1.8.1
Phoenix: 1.4.6
I removed all code from the channel. Now on join it just sends back an :ok response with an empty payload.
What I’ve tried so far:
- Increasing limits on all the workers, the controller and the node running the phoenix application. I used this script to do so:
#!/bin/bash

#limits
sudo sysctl -w fs.file-max=12000500;
sudo sysctl -w fs.nr_open=20000500;
ulimit -n 20000001;
sudo sysctl -w net.ipv4.tcp_mem='10000000 10000000 10000000';
sudo sysctl -w net.ipv4.tcp_rmem='1024 4096 16384';
sudo sysctl -w net.ipv4.tcp_wmem='1024 4096 16384';
sudo sysctl -w net.core.rmem_max=16384;
sudo sysctl -w net.core.wmem_max=16384;

echo "fs.file-max = 1048576" >> /etc/sysctl.conf
echo "# limits
* soft     nproc          1048576
* hard     nproc          1048576
* soft     nofile         1048576
* hard     nofile         1048576
root soft     nproc          1048576
root hard     nproc          1048576
root soft     nofile         1048576
root hard     nofile         1048576
" >> /etc/security/limits.conf
echo "session required pam_limits.so" >> /etc/pam.d/common-session
sysctl -p

touch /root/setup_log
echo "COMPLETE AT: $(date)" >> /root/setup_log
- Different versions of tsung, different settings.
- Tried the websocket instead of tcp on tsung but it wasn’t sending messages properly
- Switched over to using releases instead of doing mix phx.server
- Removed all application code, only replying with an :ok and empty payload
- Deploying a new version straight on the VPS, avoiding docker and k8s
- Turned logger level to
warn
<?xml version="1.0"?>
<tsung loglevel="warning" version="1.0">
  <clients>
    <client host="tsung-worker-1" use_controller_vm="false" maxusers="64000" cpu="6">
      <ip scan="true" value="eth0"/>
    </client>
    <client host="tsung-worker-2" use_controller_vm="false" maxusers="64000" cpu="6">
      <ip scan="true" value="eth0"/>
    </client>
    <client host="tsung-worker-3" use_controller_vm="false" maxusers="64000" cpu="6">
      <ip scan="true" value="eth0"/>
    </client>
    <client host="tsung-worker-4" use_controller_vm="false" maxusers="64000" cpu="6">
      <ip scan="true" value="eth0"/>
    </client>
    <client host="tsung-worker-5" use_controller_vm="false" maxusers="64000" cpu="6">
      <ip scan="true" value="eth0"/>
    </client>
  </clients>
  <servers>
    <server host="134.209.166.67" port="9962" type="tcp"/>
  </servers>
  <load>
    <arrivalphase phase="1" duration="300" unit="second">
      <users maxnumber="2000000" arrivalrate="2000" unit="second"/>
    </arrivalphase>
  </load>
  <options>
    <option name="ports_range" min="1025" max="65535"/>
  </options>
  <sessions>
    <session name="websocket" probability="100" type="ts_websocket">
      <request>
        <websocket type="connect" path="/socket/v1/websocket?vsn=2.0.0"/>
      </request>
      <request>
        <websocket type="message">          ["1", "1", "payload:url!!!commondatastorage.googleapis.com/gtv-videos-bucket/sample/BigBuckBunny.mp4","phx_join", {}]        </websocket>
      </request>
      <for var="i" from="1" to="1000" incr="1">
        <thinktime value="30"/>
      </for>
    </session>
  </sessions>
</tsung>
Results:
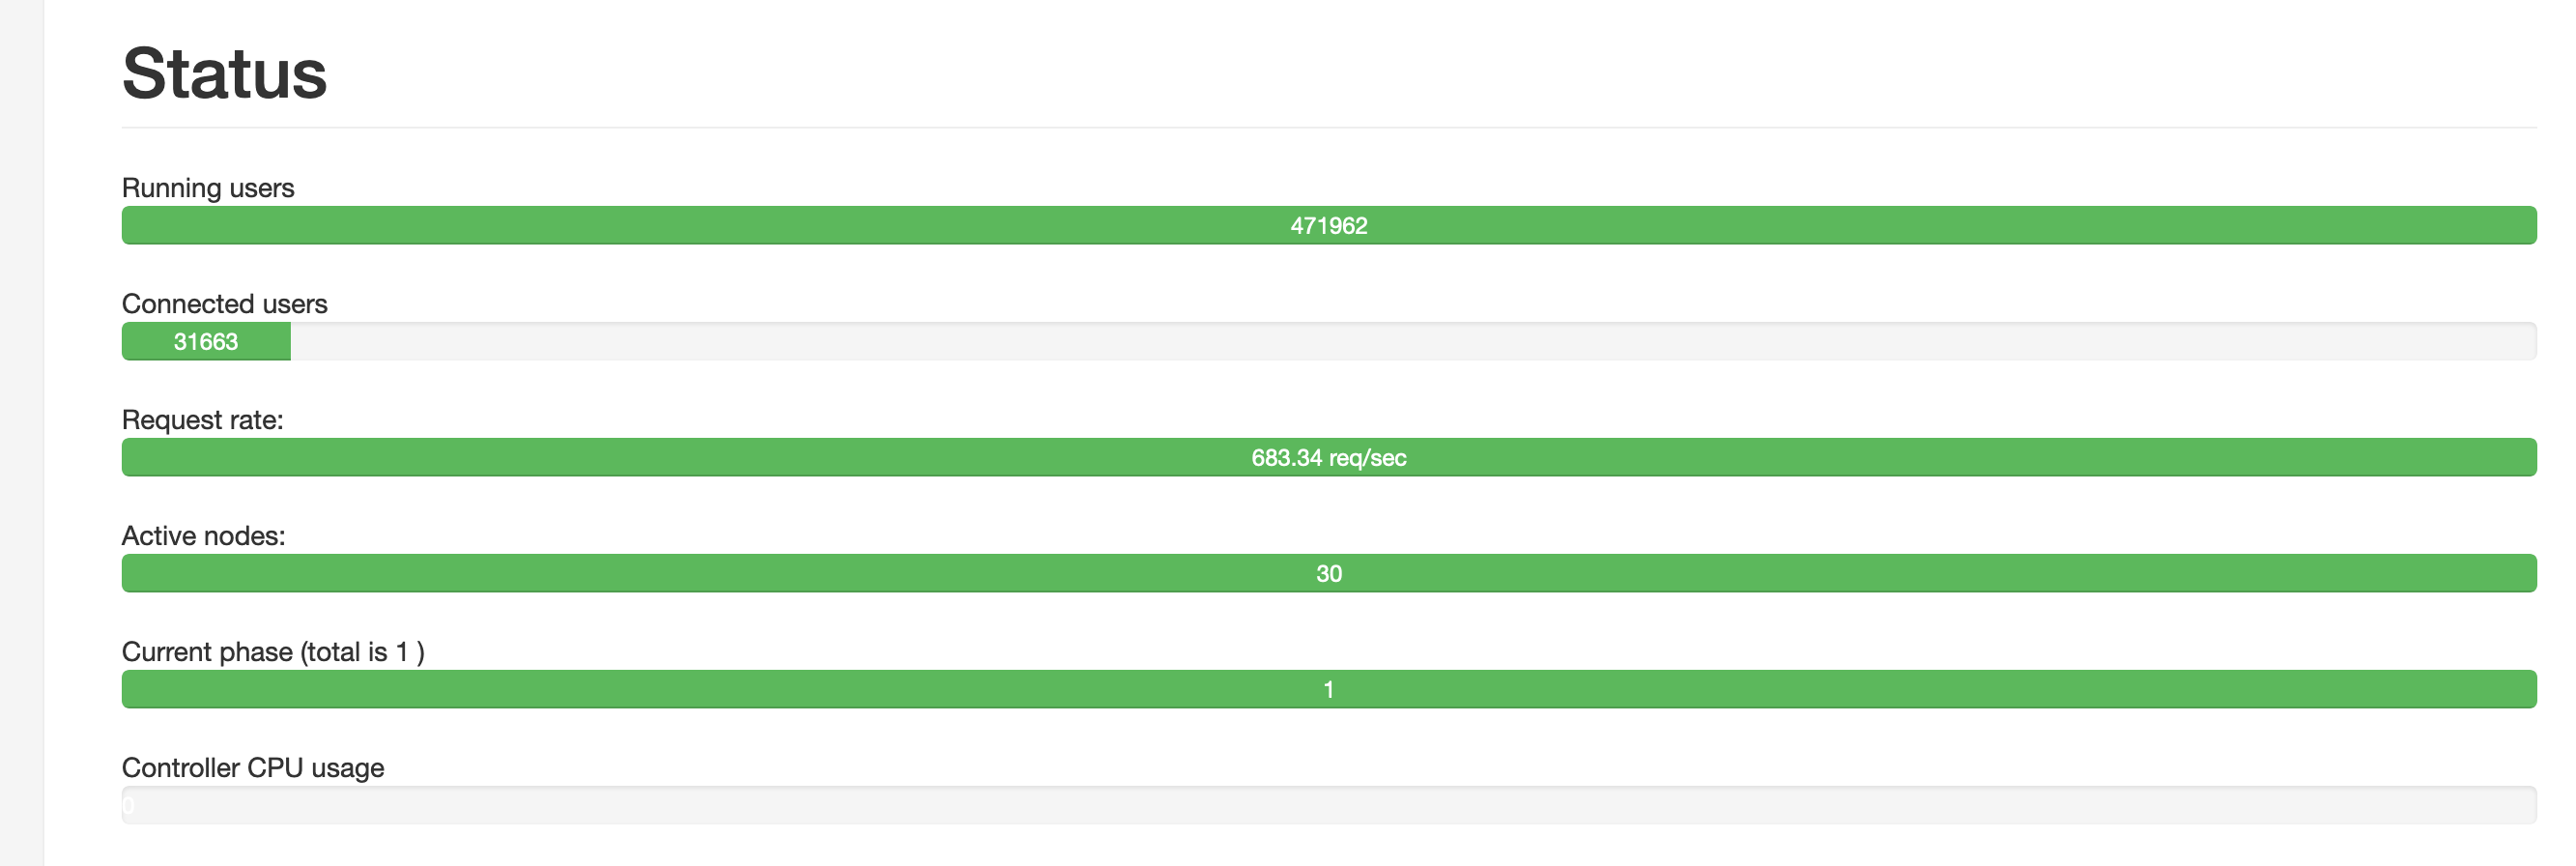

I am only hitting about 60% CPU usage and 50% memory usage. Does anyone know how many connections I should be reasonably be expecting on a server this size?
Marked As Solved
outlog
would think 60 seconds is the default timeout for Phoenix Channels (or rather the socket phoenix/lib/phoenix/transports/websocket.ex at main · phoenixframework/phoenix · GitHub) .. since you are not sending heartbeats, the channels will close down - pretty much at the same rate as new ones are added - thus the flatline..
see https://gist.githubusercontent.com/Gazler/53b842764f778fe57757/raw/9509c3d980f13bbb739f4ae117dc84ef1d721076/phoenix.xml which might help (it sends the heartbeats..)- though I’m searching for a more recent config.
      <for var="i" from="1" to="10" incr="1">
        <thinktime value="10"/>
        <request>
          <websocket ack="no_ack" type="message">{"topic":"phoenix","event":"heartbeat","payload":{},"ref":"3"}</websocket>
        </request>
      </for>
alternatively:
set the phoenix channel timeout to infinity.. eg
user_socket.ex:
transport(:websocket, Phoenix.Transports.WebSocket, timeout: :infinity)
Also Liked
praveenperera
Oh wow that was it! Thanks a lot. I had the heartbeat message in on an earlier test configuration but I was having the same problem. Might have been caused by something else at the time. But it seems to be working now! I had a feeling it was going to be something simple that I over looked.
Thanks for everyone’s input and help!
The commit that fixed it: Set websocket timeout to infinity · praveenperera/bare_channel@00d5653 · GitHub
NOTE: I am getting different errors and crashes around 140 secs now, but I can definitely work through them.
I will report back, I am curious to see what it takes to max out this box (8GB, 4CPU $40/month)

praveenperera
praveenperera
I ran two tests
- On VPS (no k8s) using distillery release: Add and configure distillery for releases · praveenperera/bare_channel@ba93e01 · GitHub

- On K8s cluster using distillery release: Add dockerfile and release script · praveenperera/bare_channel@d540f68 · GitHub
- Docker image: praveenperera/bare_channel:master

I feel like I’m probably missing something again because this is a huge drop. I think I’m going to do the rest of my testing on the VPS and come back to trying to improve performance on the K8s cluster.
More info on cluster:
- Running on DigitalOcean managed K8s (DOKS)
- 3 8GB/4vCPU worker nodes
- Workload running on one node without any other workloads
- Tsung connects directly to the node using Nodeport service
Popular in Questions


Other popular topics


 Latest Phoenix Threads
Latest on Elixir Forum
Sponsor Spotlight

Develop your skills with books, videos, and courses.
Categories:
Sub Categories:
Forums
Popular Tags
- #ecto
- #liveview
- #troubleshooting
- #learning-elixir
- #deployment
- #library
- #erlang
- #testing
- #genserver
- #mix
- #absinthe
- #remote-other
- #otp
- #plug
- #how-to-question
- #macros
- #postgres
- #channels
- #elixirconf
- #exunit
- #discussion
- #code-sync
- #javascript
- #podcasts
- #onsite
- #dialyzer
- #docker
- #authentication
- #umbrella
- #full-time-contract
- #podcasts-by-brainlid
- #ecto-query
- #elixir-ls
- #phoenix_html
- #iex
- #blog-post
- #graphql
- #genstage
- #ai
- #websockets
- #supervisor
- #elixirconf-us
- #advent-of-code
- #distillery
- #processes
- #forms
- #api
- #metaprogramming
- #security
- #hex
Our Sponsors

Build Elixir applications with speed and confidence.

Supporting innovation across the BEAM ecosystem.

We build reliable cloud platforms for business-critical systems.

Catch errors, track performance, monitor hosts and more.

Error tracking for Elixir devs who love to ship. Start your free account.
Develop your skills with books, videos, and courses.

Producing high quality Elixir screencasts since 2017.

Enabling companies to succeed by building software people love.

The team behind Membrane, Popcorn, LiveDebugger. Available for hire.

Courses that'll move you from confusion to "Aha, now I get it!"