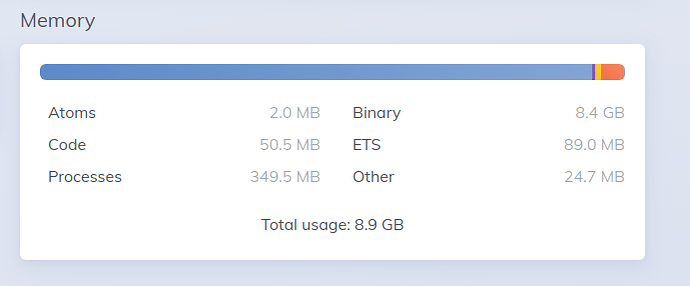
Massive increase in binaries using Finch

I am using finch in my application, what my application do is:

It sends a request to the camera for getting a jpeg, (Basic/Digest auth) and get the binary image, and then send it to another cloud.

so if I have 500 cameras they are sending 500 * 2 requests per second.

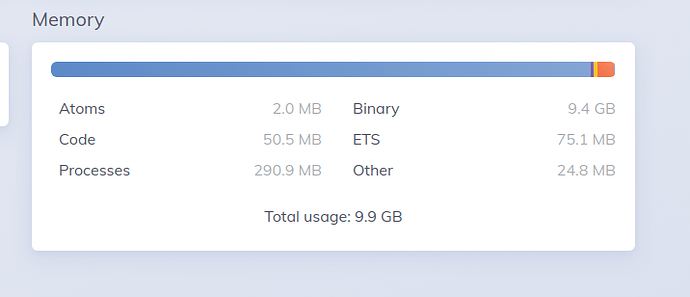
I was using HTTPoison before and my binary state on phoenix dashboard was like this
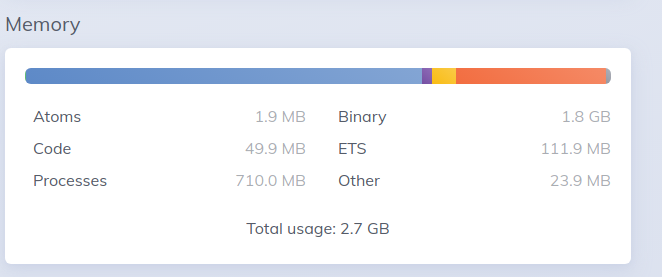
image

but when I deployed with Finch.

I had these pool settings with hackney

  :hackney_pool.child_spec(:snapshot_pool, timeout: 50_000, max_connections: 10_000),
  :hackney_pool.child_spec(:seaweedfs_upload_pool, timeout: 50_000, max_connections: 10_000),
  :hackney_pool.child_spec(:seaweedfs_download_pool, timeout: 50_000, max_connections: 10_000)

and I have these settings with Finch now

  {Finch,
   name: EvercamFinch,
   pools: %{
     :default => [size: 500, max_idle_time: 25_000, count: 5]
   }},

I want to know the reason of such massive binary increase?

UPDATE:

this is what I am using to make requests

defmodule EvercamFinch do
  def request(method, url, headers \\ [], body \\ nil, opts \\ []) do
    transformed_headers = transform_headers(headers)

    Finch.build(method, url, transformed_headers, body)
    |> Finch.request(__MODULE__, opts)
    |> case do
      {:ok, %Finch.Response{} = response} ->
        {:ok, response}

      {:error, reason} ->
        {:error, reason}
    end
  end

  defp transform_headers([]), do: []

  defp transform_headers([{key, _value} | _rest] = headers) do
    case is_atom(key) do
      true -> transform_headers(headers, :atom)
      false -> headers
    end
  end

  defp transform_headers(headers, :atom) do
    headers
    |> Enum.map(fn {k, v} ->
      {Atom.to_string(k), v}
    end)
  end
end

This is how my process look for NimblePool

even with small size and count. why the NimblePool has increased to 2500+?
I’m not really surprised that NimblePool has a lot of processes based on your settings. Your configured for 5 pools with 500 connections per pool.

I changed it to

  {Finch,
   name: EvercamFinch,
   pools: %{
     :default => [size: 50, max_idle_time: 25_000, count: 5]
   }},

and still

what you suggest?

500 * 2 request per second?

also why is there massive increase in binaries?

I can’t really make a suggestion on your pools since it’s dependent on the servers that you’re interacting with and what they’re capable of handling. My suspicion is that the responses you’re dealing with are quite large (since you’re dealing with images) and the processes dealing with those responses aren’t being killed. Large binaries have historically caused issues for the garbage collector. I’m not sure if that’s changed in recent OTP releases or not. Killing the process can help reduce memory bloat. You can also use recon, observer, and the built in beam tools to try to track down which processes are causing you issues.

2 Likes

To expand on what Chris is suggesting. You can trigger GC manually across all processes by using Process.list() |> Enum.each(&:erlang.garbage_collect/1). If you do this and the memory drops, then you know you have a memory leak.

Here’s a post on an old memory leak I tracked down and some options for how to handler them https://stephenbussey.com/2018/05/09/elixir-memory-not-quite-free.html

2 Likes

I am not interacting with servers but I am interacting with cameras,

they have an IP , port , username and password…

Also the API which I am using to upload to cloud is capable of 1000+ requests per second.

I have decreased the pool settings but isn’t it strange that with HTTPoison and Hackney the binaries were in control? or the Hackney was hiding the memory leak somehow?

Okay thank you.

but what are the out comes if I will let this continue to happen?

Would that crash the application at some point?

It’s really hard to say without understanding what your code is doing. I have a general idea, but in this case the details matter. It would be useful to see which processes are using up the most memory. It’s definitely interesting and worth digging into, but I can only speculate without more information.

1 Like

Okay Thank you, I will get back to you with as much information as I can.

is it true that even while having no pool configuration in {Finch, name: Everjamer},…

when you do a get request, it does init oneNimblePool.init/1 and when you start doing 1 get and 1 post request.

It inits, 2 NimblePool.init/1 ?

I’m not sure I understand exactly what you’re asking. If you don’t specify a pool configuration finch will use the default pool configuration.

In my gen server I am doing 2 requests, one is GET and one is POST.

When GenServer was only doing a GET request. in Phoenix Live Dashboard process, there was only one NimblePool.init/ but when I started doing 2 requests, one POST and one GET.

It has inited 2 NimblePool.init/ . my question is, is this a right behaviour?

Are both requests to the same host + port combination?

1 Like

nope.

different port and host.

Then of course 2 pools are started. I already explained before the holidays in the slack that finch starts one pool per host/port combination. (There was also a 3rd key for the pool, but I do not remember it anymore)

3 Likes

{scheme, host, port}

4 Likes

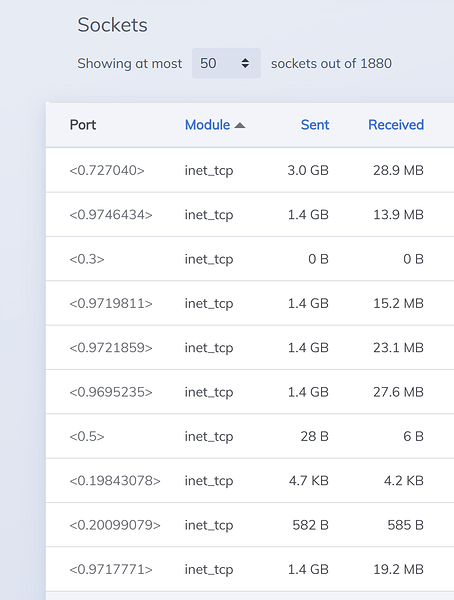
Hi, in my phoenix live dashboard on sockets tab.

I have these stats

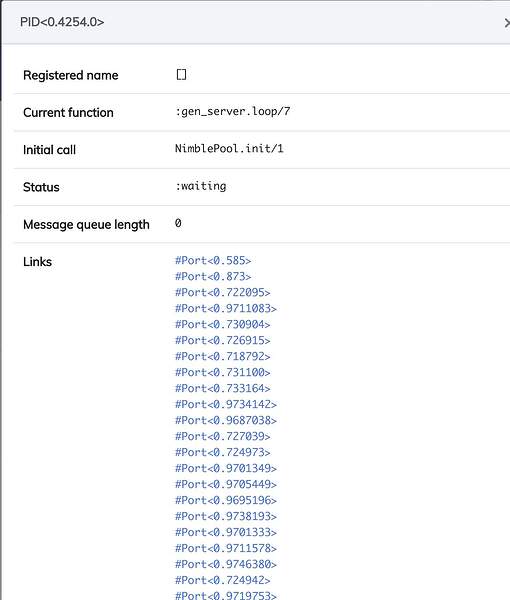
when I click on the very first socket, as well as the owner PID. it shows this

So you see this as an expected behaviour?

The inet_tcp pids are the tcp sockets that you’re sending http requests over. Based on the data, I’m guessing that those are tcp socket connections to your upstream storage api (since the “sent” is so high). The owner pid is the nimble_pool GenServer, which also makes sense. That process is the pool manager which hands out http connections to the callers.

All of that looks like what I’d expect. But, none of this really demonstrates what process is creating the excess binary memory.

1 Like

Okay Thank you.