Measuring memory consumption - how to figure out what triggers jumps in memory?

I’m trying to debug a strange jump in memory that I can’t seem to place why it happens.
I’m using live_view and one page I have a jump in memory from 150MB to over 500MB, and it only happens on one page.
Here you can see the screenshot from the LiveDashboard

The problem I have, how do I figure out what triggers this jump in memory? What tools can I use to figure this out?

2 Likes

Not really an answer to your question but I was curious where those values in the chart actually come from. It appears to be this call to :erlang.system_info({:allocator_sizes, _}).

Still not clear to me what the values actually mean, though. The docs for system_info/1 imply it’s intentionally undocumented.

2 Likes

On the problem page, what kind of work is it doing? It might give us some more insight.

2 Likes

Oh never mind, here they are. Which one is spiking in the chart? Those colors are unfortunately not very distinguishable.

2 Likes

It’s the driver allocator line, not sure what that means?

I have been able to find the call that blows up the memory, but I don’t understand what’s going on.

I have a stream that reads stuff from the database with sqlite. It’s one big table with events. The events have a stream_id.
Reading most kinds of stream_ids doesn’t increase the memory at all.
But one type of stream_id blows up the memory even if I only read one row.

I’m on my phone now, can post more details later.

1 Like

You can use the instrument — runtime_tools v2.3 module to get more information on the memory stored. This kind of tracking is enabled by default for the binary_* and driver_alloc. Given this is sqlite it’s likely some NIF related data. I also seem to remember that driver_alloc is about NIF memory.

3 Likes

Ok, I haven’t been able to use instrument yet, but I do have some interesting observations.

I’ve been able to pin it down to a specific query that when I run it with Ecto.Adapters.SQL.query! triggers the memory blowout. (I used the raw sql query to make sure it wasn’t because of the use of dynamic).

The strange/weird thing is that if I run exactly the same query directly against exqlite then the memory stays normal…
I was under the impression that ecto_sqlite3 uses exqlite so I wasn’t expecting this..

Btw, this is the query:

sql
SELECT
s0.“id”,
e1.“id”,
e1.“type”,
e1.“data”,
e1.“inserted_at”,
s0.“stream_id”,
s0.“stream_version”
FROM “stream_events” AS s0
INNER JOIN “events” AS e1 ON s0.“event_id” = e1.“id”
WHERE s0.“stream_id” = ‘$all’ AND s0.“stream_version” >= 0
ORDER BY s0.“id” DESC
LIMIT 1

Some other observations:

  • If I change DESC to ASC I don’t have the issue
  • When I change ‘$all’ to any other stream_id, I don’t have the issue

Does anyone have any thoughts on what my next steps could look like?

1 Like

I had a look at instrument. But I have no idea how to use this or interpret the numbers that come out of it.

Is this meant to be used with a tool that creates more useful insights?

I’ve been able to figure out how to use instrument. For future references. Run a script like this to get the best information out: elixir --erl “+Muatags true” sqlite_reproduction.exs

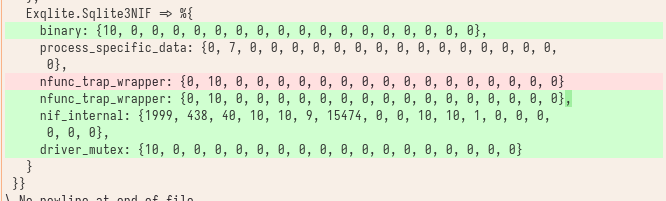
So I ran :instrument.allocations before the query and after the query, and thse are the only significant changes that I see:

So this line:nif_internal: {1999, 438, 40, 10, 10, 9, 15474, 0, 0, 10, 10, 1, 0, 0, 0,
0, 0, 0}

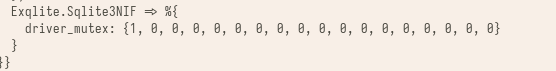
Running with exqlite gives me no such thing:

image

For completeness here is the full script that I used:

Mix.install([
    {:ecto_sql, "~> 3.13.2"},
    {:ecto_sqlite3, "~> 0.22"},
    {:exqlite, "~> 0.33.1"}
])

Application.put_env(:myapp, Repo, database: "./dev.db")

defmodule Repo do
  use Ecto.Repo,
    otp_app: :myapp,
    adapter: Ecto.Adapters.SQLite3
end

defmodule Main do
  @sql ~s"""
  SELECT
    s0."id",
    e1."id",
    e1."type",
    e1."data",
    e1."inserted_at",
    s0."stream_id",
    s0."stream_version"
  FROM "stream_events" AS s0
  INNER JOIN "events" AS e1 ON s0."event_id" = e1."id"
  WHERE s0."stream_id" = '$all' AND s0."stream_version" >= 0
  ORDER BY s0."id" DESC
  LIMIT 1
  """

  def sqlite do
    IO.inspect "before"
    print_memory()
    save_allocations("./before_sqlite")


    {:ok, _} = Repo.start_link([])
    _s1 = Ecto.Adapters.SQL.query!(Repo, @sql, nil)

    IO.inspect "after"
    print_memory()
    save_allocations("./after_sqlite")
  end

  def exqlite do
    IO.inspect "before"
    print_memory()
    save_allocations("./before_exqlite")

    {:ok, conn} = Exqlite.Sqlite3.open("./dev.db")
    {:ok, statement} = Exqlite.Sqlite3.prepare(conn, @sql)
    {:row, _results} = Exqlite.Sqlite3.step(conn, statement)
    IO.inspect "after"
    print_memory()
    save_allocations("./after_exqlite")
  end


  defp print_memory() do
    IO.inspect "memory: #{:erlang.memory(:total) / 1_000_000}"
  end

  defp save_allocations(name) do
    {:ok, x} = :instrument.allocations
    File.write!(name, inspect(x, limit: :infinity, pretty: true))
  end
end

# Main.sqlite()
Main.exqlite()

2 Likes

Hey :waving_hand:
a bit late to the party, but in the past I happily used recon for discovering which process was greedy of memory.

Check out proc_count function.

For instance, you can do something like that:

```

:memory
|> :recon.proc_count(10)
|> Enum.each(fn {pid, _bytes, _info} ->
  case Process.info(pid, [
         :registered_name,
         :memory,
         :message_queue_len,
         :initial_call,
         :current_stacktrace,
         :current_function,
         :reductions,
         :dictionary
       ]) do
    nil ->
      :ok

    info ->
      # .. do your stuff: log, send telemetries, etc.
  end
end)
```

Good luck :crossed_fingers:

1 Like