Memory leak (binaries) that only :recon.bin_leak/1 helps with

I have an app that is misbehaving. It’s deployed to Gigalixir and there are two problems with it as far as I can tell: one is that it has mysterious memory spikes that are causing OOM / killed problems, the other one is a slow binaries leak when I make HTTP requests to download external files.

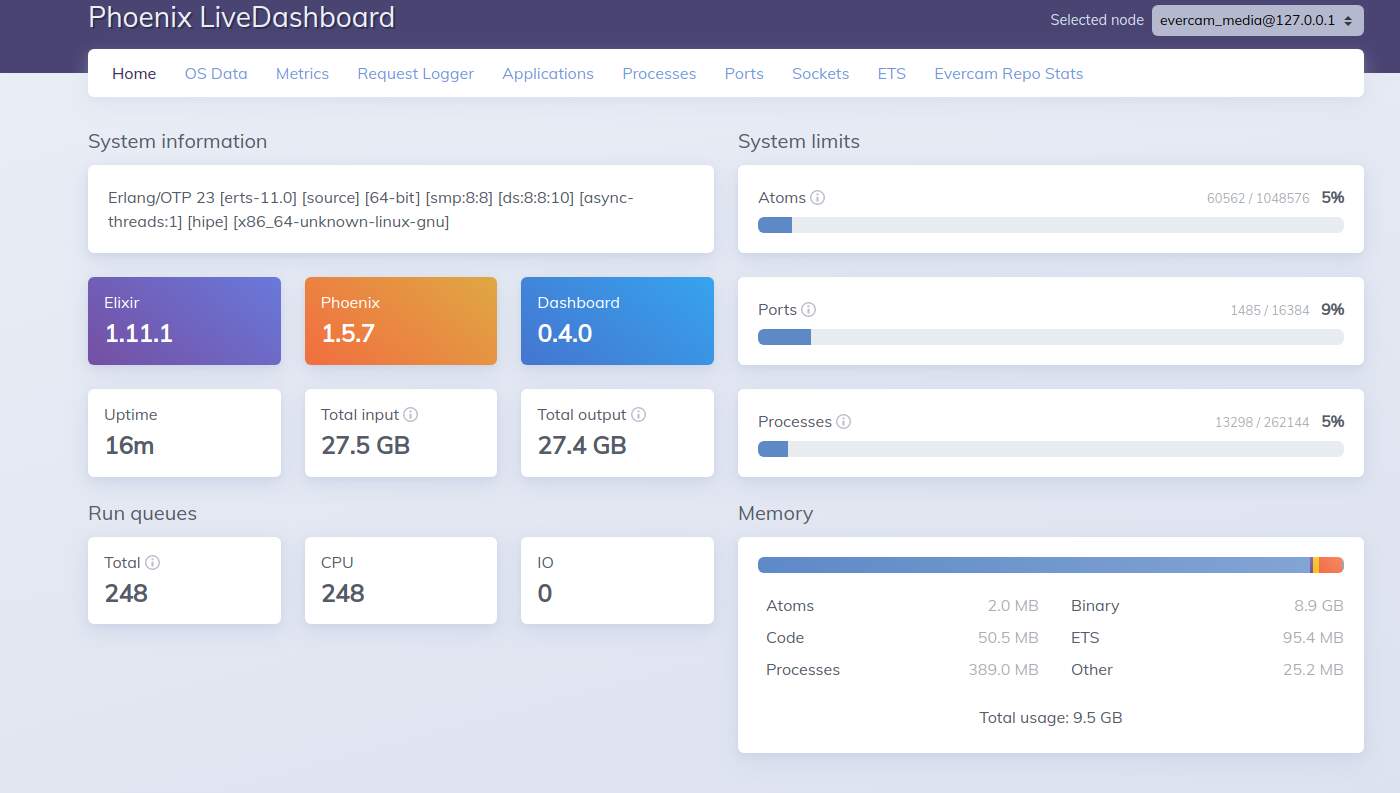
While I am struggling with the first issue, maybe the solution to the second will soft out the first too. So the bin leak issue can be easily observed on the app. Freshly after it’s deployed, Phoenix LiveDashboard shows minimal memory usage:

bin_leak1

Now, the only thing I have to do to cause trouble is to download some files, and it doesn’t matter how I really do it. I can use HTTPoison with sync or async response, or I can use Mojito / Mint. I don’t have to write files to disk, I can ignore them. I can download them in a spawned process / Task, and never care about return value. The memory used by BEAM on the server just keeps growing.

For example, when I do several HTTP requests like this, to download a 17MB file, and completely ignore it:

iex> task = Task.async(fn -> Mojito.get(url, [auth]); :ok end); Task.await(task)
:ok 
iex> task = Task.async(fn -> Mojito.get(url, [auth]); :ok end); Task.await(task)
:ok 
iex> task = Task.async(fn -> Mojito.get(url, [auth]); :ok end); Task.await(task)
:ok 
iex> task = Task.async(fn -> Mojito.get(url, [auth]); :ok end); Task.await(task)
:ok 
iex> task = Task.async(fn -> Mojito.get(url, [auth]); :ok end); Task.await(task)
:ok 
iex> task = Task.async(fn -> Mojito.get(url, [auth]); :ok end); Task.await(task)
:ok 
iex> task = Task.async(fn -> Mojito.get(url, [auth]); :ok end); Task.await(task)
:ok 
iex> task = Task.async(fn -> Mojito.get(url, [auth]); :ok end); Task.await(task)
:ok 
iex> task = Task.async(fn -> Mojito.get(url, [auth]); :ok end); Task.await(task)
:ok 
iex> task = Task.async(fn -> Mojito.get(url, [auth]); :ok end); Task.await(task)
:ok 

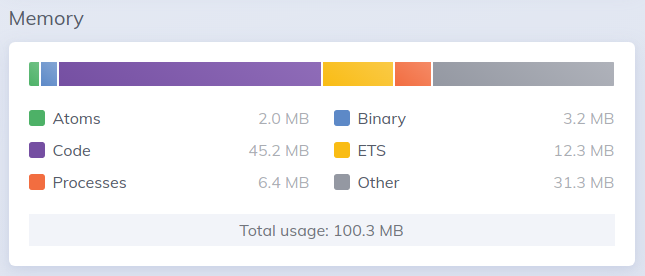
I can see the BEAM memory growing in both AppSignal and LiveDashboard:
bin_leak2
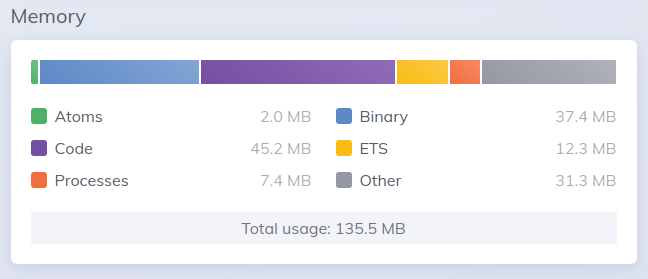
and then after several more requests:
bin_leak3

The system has a low number of fullsweep_after_flag set, and I tried setting it to 0 with no difference:

iex> :erlang.system_flag(:fullsweep_after, 0)
0

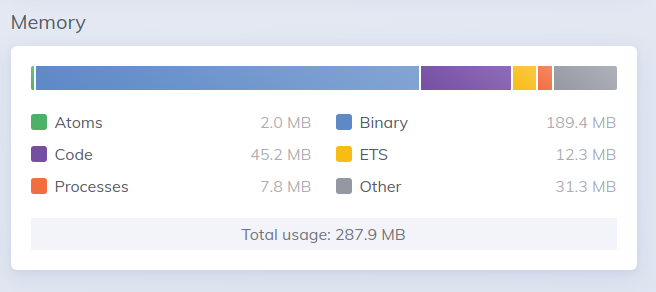
So the memory keeps growing in the “Binaries” section, and I am pretty sure it’s the HTTP response (that I ignore) accumulating and eating up the memory.

Interestingly, manuallly triggering GC run does not help either. :erlang.garbage_collect() has no effect.

The only thing that does help to release the memory is running :recon.bin_leak/1

So I do have a binaries leak, and I suspect it’s nothing specific to my code but rather a configuration / setting / flag issue.

The binaries stay at around 250-300 MB and never get cleaned up unless I manually kick in :recon.bin_leak/1.

Since this app is running on a low memory instance (0.6GB), this is a real issue as it experiences occasional crashes because it runs out of memory.

I am using Elixir releases, with Elixir 1.1.2 and Erlang 23.1. As part of this adventure I already upgraded from Elixir 1.1.1 and Erlang 22.2, where the issue was the same.

Any ideas? I am running out of hair to pull.

3 Likes

Keep in mind when calling :erlang.garbage_collect() it only calls .garbage_collect on the current pid. If you want to run a Garbage Collect on all pids you need to Process.list |> Enum.each(&:erlang.garbage_collect/1).

This is a good point but doesn’t solve the core issue.

Do you get the same issue locally in development? I wonder if there’s a bug in mojito. Do you get the same memory leak with finch (https://github.com/keathley/finch)?

1 Like

I will try finch, that’s Nth time someone mentioned it to me. Yes, the same binary leaking issue is present in development.

I don’t see binaries growing when using Finch :sweat_smile:

2 Likes

Really cool to see that Finch solved this problem! My best guess as to why it did is that Mojito uses poolboy, where the pool worker always owns the connection. Request data has to be sent and copied into the worker process and then the response has to be sent and copied back to the caller. With Finch, and NimblePool, we just transfer connection ownership to the caller, which allows you to skip the copying between processes.

2 Likes

Yes, good job on Finch.

Interestingly, both Mojito and HTTPoison had this issue showing up for me, and both of them use Poolboy and copy over the binaries as you say.

I am in the process of switching the project to use Finch at the moment and so far it looks very good. One issue I have is that I need to send streaming multipart requests with large files, currently doing that streaming with Hackney, but I am working on Finch support for streaming requests (opened WIP PR here https://github.com/keathley/finch/pull/105), and I am using https://github.com/teamon/tesla/blob/master/lib/tesla/multipart.ex to build the actual Stream containing the request body, multipart-encoded that can be streamed with Finch just like I do with Hackney. So far so good.

In long run, I’d love this code being pulled out of Tesla to separate library, so my dependencies are lighter.

So my idea is:

  • add support to streaming requests to Finch (WIP PR is there)
  • extract Tesla.Multipart to stand-alone lib
  • write some documentation on how to marry the two to perform streaming multipart requests the way I am doing them
2 Likes

Great! FYI, I went ahead and opened an issue on Mojito: https://github.com/appcues/mojito/issues/76

1 Like

Thanks! I’m very proud to see this growing interest in Finch. I definitely agree that streaming request bodies is a useful feature to add. I haven’t had too much free time to look very closely at you PR yet (my daughter was born on Tuesday :smiling_face_with_three_hearts:), but the usage of Tasks is sticking out to me as something I think we should try to avoid, since this could cause the same kind of inter-process copying that we do not want. Are you sure that they are necessary?

6 Likes

Could the streaming request implementation be done with Elixir streams? Then sending the body is a matter of calling Enum.reduce on the stream as we send it over the socket?

1 Like

That’s exactly what I was thinking! Enum.reduce a Stream with Mint.stream_request_body/3

Yes, and I think this is done with Elixir stream although I could update the code to use reduce. I think the only issue here with not creating separate process is that Mint.stream_request_body seems to just hang when sending goes slow and I needed to impose a timeout on the whole process. Need to look closer into what the issue here is, but I think if it is a blocking operation then we do need to wrap it into own process so we can interupt it.

@hubertlepicki I think wrapping the whole operation is probably preferred to wrapping the streaming in itself. Specially if you can move the stream generator to inside the wrapped process, to reduce the amount of copy.

1 Like

it’s the way to investigate and solve the core issue though.

The bin_leak call should tell you which process is shedding the more load because the only thing it does is:

a) look for the binary memory for all processes in the node
b) run a GC in all processes on the node
c) look for the binary memory for all processes in the node (again)
c) output the top ones

by looking into which processes are shedding load you can easily find which operations are problematic. It seems from context here that it would be a pooling issues for data going through it, but as documented in Erlang in Anger, there are also ways to work around that (a common one being to hibernate to compact memory usage, and another one being to avoid some copies of binary by sending other information around, which finch likely does here).

I would advise in general to dig and understand the pattern you see ongoing, because it will help you gain the knowledge and experience to prevent it from happening within your own code in the future, and also to know at a glance whether a library you’re about to add to your project is likely to show the same problems before you actually try it in production.

7 Likes

As discussed above, the binaries are left on poolboy processes spawned to process request, then they get returned to the pool and do nothing while different process is fetched from pool. It gets returned to pool, and also does nothing, so GC doesn’t kick in for these two processes. Having big pool of workers, with relatively small amount of requests per minute, and these requests leaving a lot of binaries (as they process large payloads) leads to accumulating binaries on poolboy workers that are returned to the pool. The bigger pool you have the worse you are.

That’s how I understand what’s going on :slight_smile:

Hi! Mojito author here. Thanks for this report; we’ve added a call to :erlang.garbage_collect/1 in the right place in Mojito 0.7.6, and OP confirms that this solves his memory issue. This was fun!

2 Likes

hi, today we switched to Finch from HTTPoison. with such pool options.

  {Finch,
   name: EvercamFinch,
   pools: %{
     :default => [size: 5_000, max_idle_time: 25_000, count: 10]
  }},

We are sending 500+ requests to cameras to fetch jpegs and then save it to an other file system.

so in case of one camera, 2 requests are working with per second/per minute.

After deploying.

the binaries seem to be increased much more than before. :smiley:

we are on elixir, 1.11.1 and OTP 23.

Can you suggest something?

This problem has re-surfaced in slightly different form also for me. Now instead of HTTP client genservers accumulating the binaries, it’s processes of the UI.Endpoint.Registry in my app, plus PubSub processes that are doing that. These are used with Absinthe subscriptions that actually send some data to clients, and it happens frequently. So these processes are definitely not inactive, maybe on the contrary.

Example output from :recon.bin_leak(1000):

[                                                                                   
  {#PID<0.8356.0>, -32520,                                                          
   [                                                                                
     UI.Endpoint.Registry.PIDPartition1,                                            
     {:current_function, {:gen_server, :loop, 7}},                                  
     {:initial_call, {:proc_lib, :init_p, 5}}                                       
   ]},                                    
  {#PID<0.8100.0>, -29784,                                                          
   [                                                                                
     Emails.PubSub.PIDPartition0,                                                   
     {:current_function, {:gen_server, :loop, 7}},                                  
     {:initial_call, {:proc_lib, :init_p, 5}}                                       
   ]},                  
  {#PID<0.7875.0>, -641,                                                            
   [                                                                                
     :tzdata_release_updater,                                                       
     {:current_function, {:gen_server, :loop, 7}},                                  
     {:initial_call, {:proc_lib, :init_p, 5}}
   ]},                                                                              
  {#PID<0.7899.0>, -360,                                                            
   [                                                                                
     Infra.Registry.Crdt,                                                           
     {:current_function, {:gen_server, :loop, 7}},
     {:initial_call, {:proc_lib, :init_p, 5}}                                       
   ]},                                                                              
  {#PID<0.7673.0>, -315,                                                            
   [                                                                                
     :tls_connection_sup,
     {:current_function, {:gen_server, :loop, 7}},
     {:initial_call, {:proc_lib, :init_p, 5}}     
   ]},

I honestly am running out of ideas. FULLSWEEP_AFTER is set to zero, no effect, processes keep growing. This is super weird, and I don’t think I have the energy to battle against it anymore, I just decided to set up :recon.bin_leak(1000) as a recurring task every minute and for now be done with it. Feels like Rails in 2008 but what can you do about it.

It is very weird to see PIDPartition listed there, as it literally does two things:

  1. handles a :sync, which is just an atom and has no binaries

  2. handles :EXIT which then reads from ETS

Reading ETS is not going to create references, so I can only see this happening if for some reason those processes are exiting with a binary as reason which then becomes part refed.

Can you try the following? For those processes that go to the registry, can you do this when they are spawned:

parent = self()

spawn(fn ->
  ref = Process.monitor(parent)
  receive do
    {:DOWN, ^ref, _, _, reason} -> IO.inspect({:exit, reason})
  end
end)

I want to see what are their exit reasons.