Hi all,
Heroku keeps killing the application because the memory quota is vastly exceeded (i.e. 220% of the quota is used). I’m trying to find the root cause of this. The application use the PhoenixLiveDashboard so I could inspect the processes using the most memory …
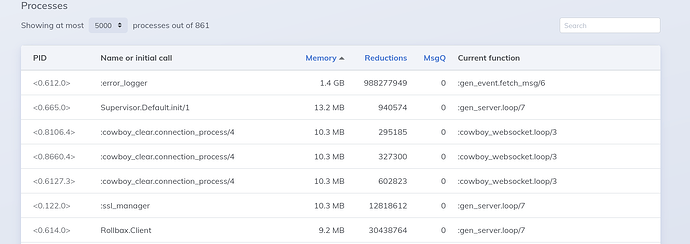
As you can see in the following picture, there is an :error_logger process that is using more than 1 GB of memory. Surely it isn’t normal right?
How can I find which piece of my code is responsible for spawning the :error_logger process and why is it accumulating so much data?
Could it be due to some Telemetry misconfiguration in the application?
I see here that Telemetry uses an error_logger module. Also I see that Elixir’ Logger uses this error_logger module by default here.
Thanks!
Both Elixir and Telemetry use error_logger only if you are using Erlang 20.x or earlier. In other situations it is not started unless there is other component that registers error_logger:add_report_handler/{1,2}.
If you are using OTP 20.x or earlier, then this process is started as part of kernel application and you cannot disable it (as this could cause you to lose information about processes that have failed).
1 Like
I’m using Erlang 23.0.3 with Elixir 1.11.2. And I’m not calling the error_logger:add_report_handler function anywhere in the code 
You may use dependency that does. For example Sentry still does IIRC. You can search through your deps for that function call.
Alright, I have three dependencies that makes this function call:
- lagger
- rabbit_common
- rollbax (here)
Recently, I added an ErrorReporter module to hold the logic on how a message should be reported to Rollbar when an event cannot be consumed. The error reporter module looks like so:
defmodule Shared.ErrorReporter do
  require Logger

  def report_and_log_error(
        module,
        %{error: error, event: event, metadata: metadata} = error_params
      ) do
    Rollbax.report(:error, error_params, stacktrace())

    error_message =
      "#{module} error=#{inspect(error)} consuming=#{Shared.LoggableEvent.to_log(event)} metadata=#{
        inspect(metadata)
      }"

    Logger.error(error_message)
  end

  def report_and_log_error(
        module,
        %{error: error, job: job} = error_params
      ) do
    Rollbax.report(:error, error_params, stacktrace())

    error_message = "#{module} error=#{inspect(error)} job=#{inspect(job)}"
    Logger.error(error_message)
  end

  def log_retry(module, %{error: error, event: event, metadata: metadata} = _retry_params) do
    error_message =
      "#{module} error=#{inspect(error)} consuming=#{Shared.LoggableEvent.to_log(event)} metadata=#{
        inspect(metadata)
      }"

    Logger.error(error_message)
  end

  def stacktrace do
    {_, stacktrace} = Process.info(self(), :current_stacktrace)
    stacktrace
  end
end
And this is how I call the module:
report_and_log_error(__MODULE__, %{error: error, event: event, metadata: metadata})
Rollbar allows us 50,000 requests/1 minute and the application is far away from having that many errors 
So I have diggen up further and configured my heroku app from the instructions on this article so that I can inspect the process’ state.
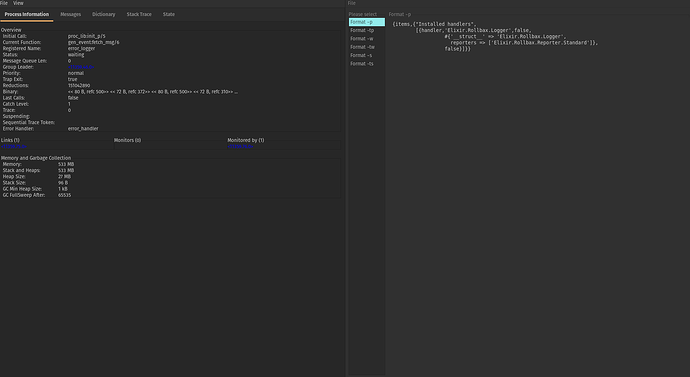
What I find really surprising is that the :error_logger process has only the following message in its state:
{items,{"Installed handlers",
        [{handler,'Elixir.Rollbax.Logger',false,
                  #{'__struct__' => 'Elixir.Rollbax.Logger',
                    reporters => ['Elixir.Rollbax.Reporter.Standard']},
                  false}]}}
The Message Queue Len is also empty. Here’s a more detailed picture of the process:
It has only 500 MB but it can grow up to =~ 1.5GB or so before Heroku kills the app …
Any ideas on how to investigate further? 
Seems like bug in Rollbax, not error_logger. Try to drop that library for test. If it help, then you have found culprit (it will probably also make error_logger process to go away). In general I prefer Sentry for error logging, so if you can switch, then it may be the interesting solution for you.
2 Likes
I’m pretty sure that this will work, however, we have many applications that use Rollbax and only one of them crashes. So I’ll take a deeper look, maybe we misconfigured something.
Disabling the enable_crash_reports “fixed” the issue because it didn’t start the error_logger process.
error_logger is actually quite known to cause memory leaks  There’s a whole section about this process in the Erlang in Anger book.
If I have some free time, I’ll try to fork Rollbax and replace error_logger with either logger or lager, because I would still like to have those crash reports.
1 Like
I highly suggest taking a look at Sentry. It always felt “cleaner” to me.
1 Like


