
FatigueDev
NIF like a champ: VS Code Debugging C/C++ NIFs
Preface ~ NIFs are rough as heck to debug properly.
So you’ve created a NIF with a decent amount of complexity and have resorted to using std::cout << "Some value is: " << value << std::endl;, only to get a Segfault because the line four lines up is the one causing the problem. Situations like this if you’ve been creating NIFs before are pretty common, but this guide is going to help you get set up and tripping breakpoints without destroying your BEAM VM.

~ Important Links ~
Installing Erlang OTP
Debugging NIFS
NIF Overview
ERL_NIF C Reference
Windows users, please read this:
The binary install of Erlang for Windows comes with a prebuild debug compilation! You can skip all the way to the VS Code & Breakpoints (Finally, Jeeze) section. The command you need to run, however, is going to omit -emu_flavour emu; instead run iex.bat --erl '-emu_type debug' -S mix. Still target the available debug.beam you have, however. Thanks, @garazdawi! (ref: corrections by garazdawi)
Basically:
In short, we need to compile a debug virtual machine.
We also need to ensure we have the required utilities to actually run these scripts and compile, too.
Getting the right version
Determine your current version of Erlang by running:
erl -eval 'erlang:display(erlang:system_info(otp_release)), halt().' -noshell
![]()
Once it spits out your number, we can use the latest version under the 27 tag. In my case, 27.1.2.
Then, head to the Erlang OTP github and find the name of the tag you should be using by filtering by tags.

You can either download as a ZIP at that point and unpack it somewhere we’re going to compile it, or run:
# Clone our selected tag to a new folder named OTP-27.1.2
git clone --depth 1 --branch OTP-27.1.2 https://github.com/erlang/otp.git OTP-27.1.2
Preconfigure and configure
Open up the folder in your preferred IDE. In the root directory of OTP-27.1.2, set a local variable used for the configure application called ERL_TOP, which is simply the full path to the directory of what we just cloned.
export ERL_TOP=pwd
You should know you set it correctly if you echo $ERL_TOP and it spits out your current directory as a full path.
Compiling is slow as heck without parallelism, so we’ll also set MAKEFLAGS as well:
export MAKEFLAGS=-j8
Now for when we’re installing, it’s going to require that we set up a prefix. This defaults to /usr/local and has to be an absolute path. What this means for Windows and Linux devs is that to set up where we eventually want it to go, we need to set it as one of our first things before we even compile. So we’ll run configure, an application within our cloned root like this:
./configure --prefix=/usr
Below is an image of configuring for the default /usr/local prefix. It’s fine, copy paste still works if we messed this up (like I did while writing ![]() )
)

It’ll spit out a bunch of checking this, ensuring that; you’ll know it’s fine as long as it doesn’t fail somewhere; in which case it’ll tell you it failed.
Compiling Erlang With Debug Enabled
Now that we’re configured, we have to first run:
make
This will do a pass and just build our typical OTP version which is fantastic. Once it’s done (should be much faster thanks to setting MAKEFLAGS=-j8), we need to specify that we’d like to create some Types and Flavours. It supports a wide range of tooling and you can find the specific type/flavour requirements here.
While we only need one, the more the merrier. Let’s run:
make TYPE=debug FLAVOR=emu
After that compiles,
make TYPE=debug
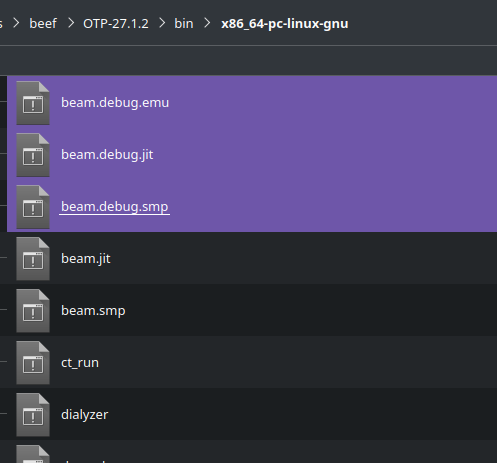
Once those finish up, we can verify that it worked as intended by simply checking if we’ve got some of these beam.debug. files in the ./bin/(architecture)/ folder:
And running the generated erlang with:
./bin/erl -emu_type debug -emu_flavor emu

Installation
We can test first by specifying we want to install to a directory inside our cloned project, just to make sure it looks fine. Of course, if we missed setting the --prefix during configuration we can set it in the Makefile at ./Makefile.
Install to a local directory to make sure it all looks fine:
mkdir install_test && make DESTDIR=$ERL_TOP/install_test install
Additionally, we’ll want to install for our debug type and flavours as well:
make DESTDIR=$ERL_TOP/install_test install TYPE=debug
make DESTDIR=$ERL_TOP/install_test install TYPE=debug FLAVOR=emu
Let’s install to the proper directory when we’re sure it all looks gucci with:
sudo make install
Important! Next we install our debug targets as well:
sudo make install TYPE=debug
sudo make install TYPE=debug FLAVOR=emu
Making sure our install worked
Now, if everything went as to be expected, we can run erl like we did earlier- Except with the Erlang we have properly installed.
Open a new terminal context to refresh the context and run:
erl -emu_type debug -emu_flavor emu
Additionally, we should be able to pass forward those erl flags to iex with:
iex --erl '-emu_type debug -emu_flavor emu'
We can triple check with:
iex> :erlang.system_info(:emu_type)
:debug
iex> :erlang.system_info(:emu_flavor)
:emu

We should see it’s got [type-assertions] [debug-compiled] [lock-checking] in our Erlang, :debug and :emu as our type and flavour. Which is fantastic!
If not, I refer you to the actual documentation where you can give it another go with the actual docs.
VS Code & Breakpoints (Finally, Jeeze)
So according to the docs for the Debug Emulator, connecting GDB to this should work out of the box. Assuming you have a project that already has a NIF in it, we’ll begin by finding the right extensions for the job.
Microsoft’s C++ - GDB Attach
Process Matcher - Absolute Time Saver; Stamp PID match
Those two tools are going to be the ones we’re going to leverage to attach to our running IEX session. So now we’ll head to project_directory/.vscode/ and make launch.json in there if it doesn’t exist already and chuck in:
{
  "version": "0.2.0",
  "configurations": [
    {
      "name": "(GDB) Attach",
      "type": "cppdbg",
      "request": "attach",
      // Program is a fully qualified path to a program to debug.
      // Fortunately for us, whatever is running in beam.debug.emu
      // also has all of our loaded symbols, or _will_ have our loaded
      // symbols when we call :erlang.load_nif/2
      "program": "/usr/lib/erlang/erts-15.1.2/bin/beam.debug.emu",
      "processId": "${input:matchDebugBeam}",
      "internalConsoleOptions": "openOnFirstSessionStart",
      "MIMode": "gdb"
    },
  ],
  "inputs": [
    {
      "id": "matchDebugBeam",
      "type": "command",
      "command": "process-matcher.match",
      // Program in here just needs to be the name of what's running.
      // Spin up iex with debug and make sure it's name matches what's in here.
      "args": { "program": "beam.debug.emu" }
    }
  ]
}
Note: Unfortunately, I haven’t as of yet found a way to allow us to attach without requiring administrative priviledges. That means that each time you hit F5 and try to attach, you’ll hit an auth wall which is irritating. I’m sure we can launch IEx in debug mode using a different launch target and attaching it like that, but this is the most reliable way I’ve found to make this happen.
Running the debugger after starting debug IEX we see the following:
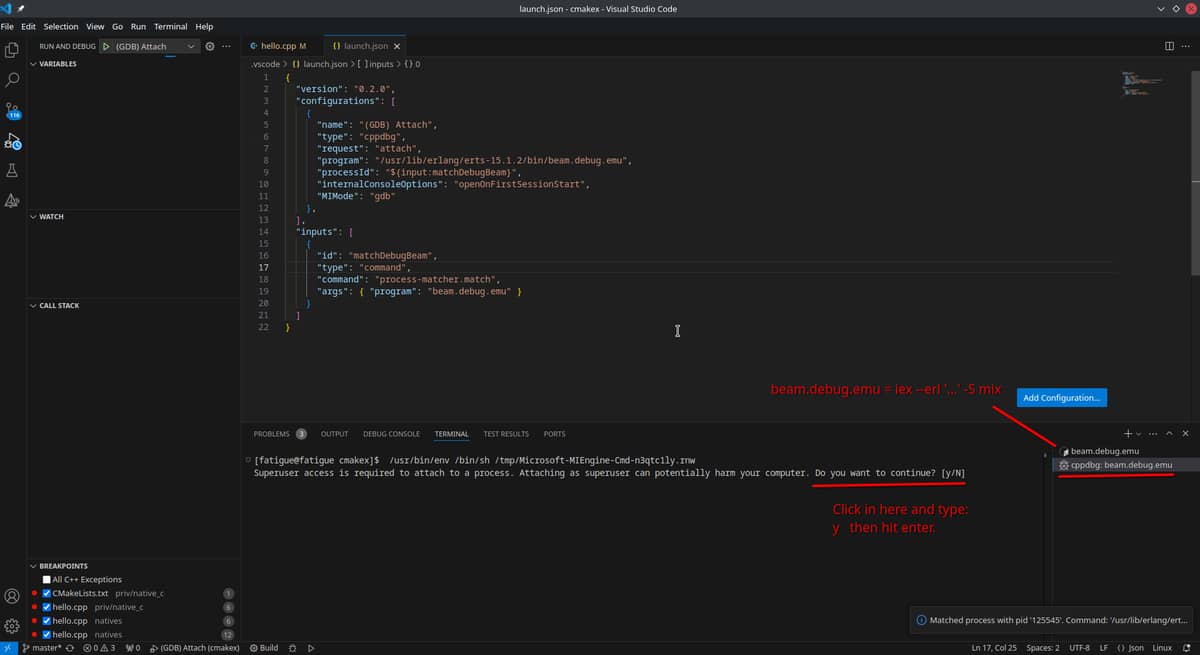
Once we authenticate, we can see that we’ve got a whole heap of processes! If you aren’t running iex in debug, you’ll know it because it will be pause/break on a thread somewhere; unable to continue unless the debugger is detached and you restart iex.

Now assuming you’ve compiled your NIF with debug symbols embedded within it with -g in gcc, clang or whatever other compiler flavour you use (Debug and not Release on Windows, I believe), when your NIF is called and the debugger in VS Code is attached gdb should trip the debugger when it hits a breakpoint set within a C or C++ file.
Observe, in this terribly choppy imgur-compressed gif which hurts my eyes:
Breakpoints in action

In any case, it should make actually debugging your NIFs a bit easier now you can hit breakpoints. You’ll still Segfault of course, but now you’ll at least have a better way of figuring out the reason by walking up the call stack and just having a look around.
Example Source:
hello.cpp
#include <iostream>
#include <erl_nif.h> // Ensure you link NIF headers! Check source for existing NIFs for examples

int main() {
    return 0;
}

static ERL_NIF_TERM check(ErlNifEnv *env, int argc, const ERL_NIF_TERM *argv) {
    int a = 5;
    int b = a + 5;
    return NULL; // Let's cause a crash, just to test! :)
    return enif_make_atom(env, "ok");
}

static ErlNifFunc nif_funcs[] = {
    {"check", 0, check, 0}
};

ERL_NIF_INIT(Elixir.Example.Nif, nif_funcs, NULL, NULL, NULL, NULL)
nif.ex
defmodule Example.Nif do
  @moduledoc false

  @nifs [check: 0]
  @on_load :onload

  def os_specific_load_path(file_name) do
    {os_family, _os_name} = :os.type()

    if os_family == :unix do
      # Change this to your shared object folder.
      to_string(Path.expand("priv/cmake_example/" <> "lib" <> file_name))
    else
      # Change this to your shared object folder (For windows, it'd just be what it already is + /Debug/ )
      to_string(Path.expand("priv/cmake_example/Debug/" <> file_name))
    end
  end

  def onload do
    # Add the name of your compiled shared object file here :)
    file = os_specific_load_path("cmake_example")
    :erlang.load_nif(file, 0)
  end

  def check, do: :erlang.nif_error("Not loaded.")
end
Summary
I’m glad I finally got this working; hope this helps aspiring NIF creators or those that already hit their heads against enif to have a much nicer development experience.
tl;dr:
- Compile & Install Erlang Debug
- Compile your C/C++ to a shared object (.so, .dll) with
-gdebug symbols - Create a launch.config configuration using that debug compiled Erlang
- Run iex using the debug emulator, run the debug launch config to attach the debugger
- Hit breakpoints like a champion
- Segmentation fault: core dumped
Edit: Replaced the important links with the actual correct links (can’t edit while post is pending)
Edit 2: Actual Erlang Core team member @garazdawi saying nice post was awesome, thanks for helping me cut out and correct the steps!
Edit 3: Generally cleaned up a little ![]()
Most Liked

garazdawi
Nice guide!
FYI you can run “make install TYPE=debug” and it should install all the debug files your want.
Windows users can run that just fine in WSL, which the entire Erlang/OTP build system is centered around. They don’t need to though as the windows installer is shipped with beam.debug.smp prebuilt, so Windows users can just run erl.exe -emu_type debug and they will get a debug emulator.
FatigueDev
Thanks for the reply! I’ll update the guide shortly. I was also wondering if I could cross post this to the Erlang forum since the major point of it is making Erlang hook properly to VS Code. Not sure if it’d be allowed or not given it’s current format is quite Elixir-y.
^ Would’ve cut the guide down to 1/4 of the size; amazing stuff!
Last Post!

AstonJ
Trending in Guides/Tuts

Other Trending Topics


Latest on Elixir Forum
Sponsor Spotlight

Producing high quality Elixir screencasts since 2017.
Categories:
Sub Categories:
Forums
Popular Tags
- #ecto
- #liveview
- #troubleshooting
- #learning-elixir
- #deployment
- #library
- #erlang
- #testing
- #genserver
- #mix
- #absinthe
- #remote-other
- #otp
- #plug
- #how-to-question
- #macros
- #postgres
- #channels
- #elixirconf
- #exunit
- #discussion
- #code-sync
- #javascript
- #podcasts
- #onsite
- #dialyzer
- #docker
- #authentication
- #umbrella
- #full-time-contract
- #podcasts-by-brainlid
- #ecto-query
- #elixir-ls
- #phoenix_html
- #iex
- #blog-post
- #graphql
- #genstage
- #ai
- #websockets
- #elixirconf-us
- #supervisor
- #advent-of-code
- #distillery
- #processes
- #api
- #forms
- #metaprogramming
- #security
- #hex
Our Sponsors

Build Elixir applications with speed and confidence.

Supporting innovation across the BEAM ecosystem.

We build reliable cloud platforms for business-critical systems.

Catch errors, track performance, monitor hosts and more.

Error tracking, logs, uptime, and Just Enough APM. Built for developers.

Develop your skills with books, videos, and courses.
Producing high quality Elixir screencasts since 2017.

Enabling companies to succeed by building software people love.

The team behind Membrane, Popcorn, LiveDebugger. Available for hire.

Courses that'll move you from confusion to "Aha, now I get it!"