
DianaOlympos
Orion - Dynamic Distributed Profiling, find hotspot in a snap
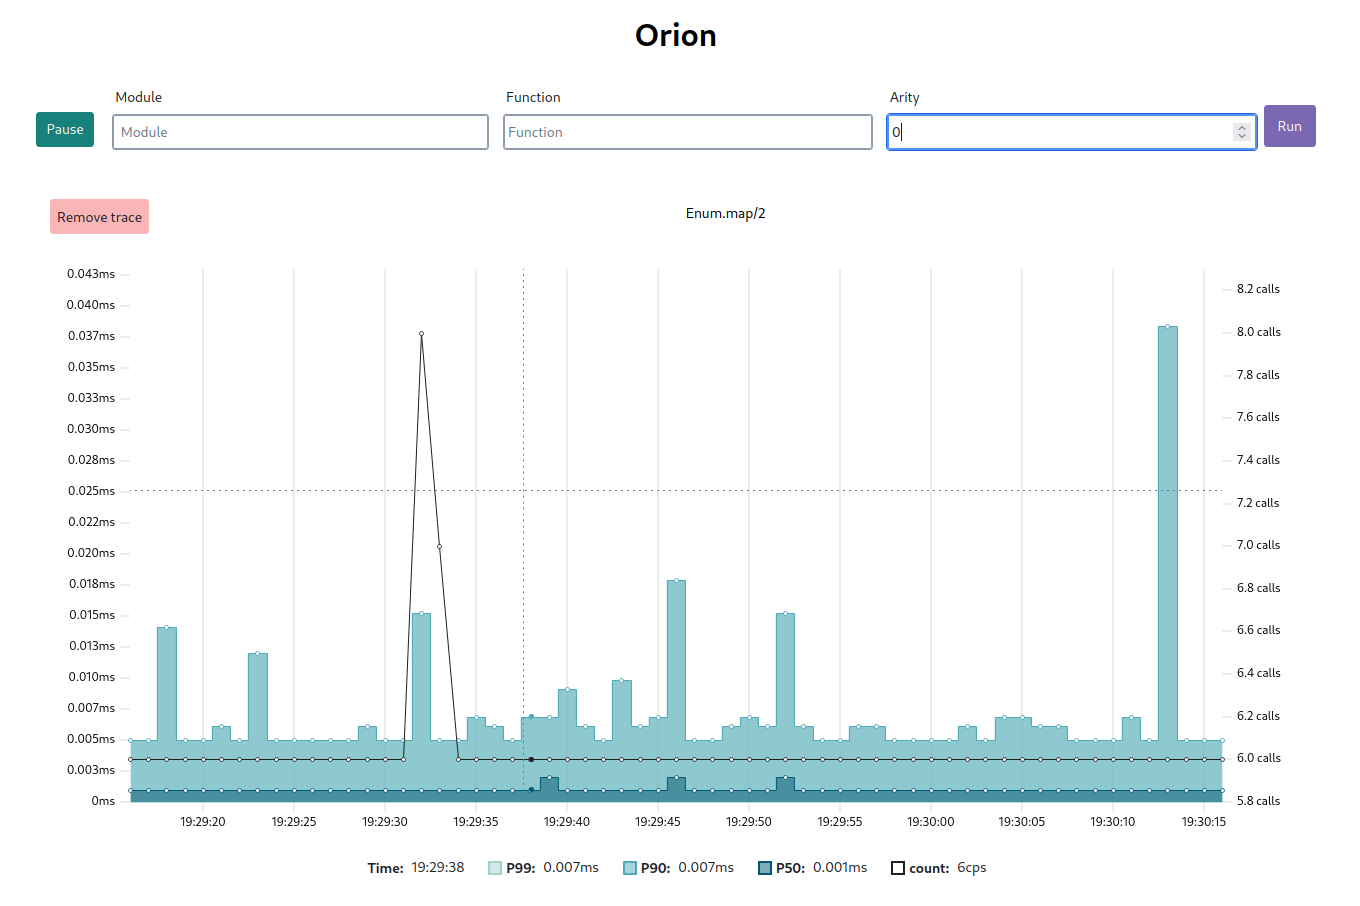
Ever had to fix “This is slow” but it was super painful? I get you, it is hard. But it became far easier just now. Because now you can profile as deep as you want, as precisely as you want, live, in production, with nice UX and nearly no impact. No need to instrument anything in advance.
Just go to your Orion page after installing it and you can profile any function call in a few seconds. Across your cluster. At any point in the future.
Want more? Feel free to talk with me, there are a lot of future features planned. This needs Elixir right now. We have plans to make it easier to use from other BEAM languages in the future, but for now, we are limiting it to this.
Most Liked
DianaOlympos
I just published 1.0.3, which fix a long standing bug that was masking it impossible to run multiple traces.
This should now be handled properly. This took a long time to fix, but it should be totally gone now (famous last words).
So please upgrade if you use Orion.
Thanks to @larshei for reporting ![]()

mayel
I listened to the ThinkingElixir podcast episode on this, and re. the discussion about adding it to LiveDashboard, this works to simply add a link to Orion in the dashboard nav:
defmodule MyApp.Web.OrionLink do
  @moduledoc false
  use Phoenix.LiveDashboard.PageBuilder

  @impl true
  def menu_link(_, _) do
    {:ok, "Orion tracing"}
  end
end
And in the router:
live_orion("/admin/system/orion")

live_dashboard("/admin/system",
        additional_pages: [
          orion: MyApp.Web.OrionLink,
...Popular in Announcing


Other popular topics


Latest on Elixir Forum
Sponsor Spotlight

Phoenix, LiveView, multimedia pipelines, distributed systems. 400 engineers, Elixir since 2017. Available for hire.
Categories:
Sub Categories:
Forums
Popular Tags
- #ecto
- #liveview
- #troubleshooting
- #learning-elixir
- #deployment
- #library
- #erlang
- #testing
- #genserver
- #mix
- #absinthe
- #remote-other
- #otp
- #plug
- #how-to-question
- #macros
- #postgres
- #channels
- #elixirconf
- #exunit
- #discussion
- #code-sync
- #javascript
- #podcasts
- #onsite
- #dialyzer
- #docker
- #authentication
- #umbrella
- #full-time-contract
- #podcasts-by-brainlid
- #ecto-query
- #elixir-ls
- #phoenix_html
- #iex
- #blog-post
- #graphql
- #genstage
- #ai
- #websockets
- #supervisor
- #advent-of-code
- #elixirconf-us
- #distillery
- #processes
- #forms
- #api
- #metaprogramming
- #security
- #performance
Our Sponsors

Build Elixir applications with speed and confidence.

Supporting innovation across the BEAM ecosystem.

We build reliable cloud platforms for business-critical systems.

Catch errors, track performance, monitor hosts and more.

Error tracking for Elixir devs who love to ship. Start your free account.

Practical resources that improve the lives of professional developers.

Develop your skills with books, videos, and courses.

Enabling companies to succeed by building software people love.
The team behind Membrane, Popcorn, LiveDebugger. Available for hire.

Courses that'll move you from confusion to "Aha, now I get it!"