Unfortunately, I don’t see any link to the code so I’m not sure there’s much analysis to be done without it, but the analytics seemed interesting.
2 Likes
I’m betting it is throttled by the database, never heard of that one or how it performs or how the elixir libraries for it work with it nor do we know what pooling settings everything was set up to or anything of the sort. There is no information here that you could really base any decision off of sadly… 
3 Likes
Agree with ODL, and without actual code we should take these comparisons with a pinch of salt.
1 Like
Actually came out about like I expected 
1 Like
I really liked how tight the response time deviation was with Elixir. Some of the graphs started to look as though they were cut from SoundEdit.
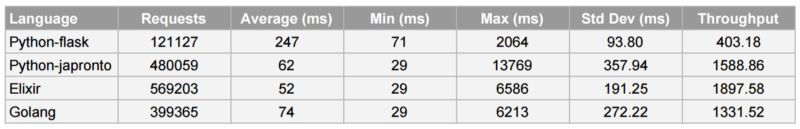
I agree with @OvermindDL1 that Amdahl’s law is showing up via the database. The last set of results are likely a more realistic representation of the frameworks themselves.
2 Likes
This line was my favorite:
It’s also far more economical when it comes to the actual amount of code needing to be written; it took me around 100 lines of code in Go to do the same as with 20 lines with Elixir and 35 with Python.
3 Likes
I dropped a comment on the article but I will repeat it here. The spikes in Elixir graph may be caused by Cowboy’s max_keepalive which defaults to 100. After 100 requests, the connection is closed and a new one is required.
The 100 default is quite reasonable for applications but it does show up in benchmarks. @sasajuric has written a very good article on the topic: http://theerlangelist.com/article/phoenix_latency
7 Likes


