Hi all,
I have a classical phoenix / absinthe / ecto web app, providing GraphQL API to the front-end.
I use PostgreSQL as a database.
The main table has 200k rows and the API is providing search feature on it.
The API call are quite slow : 7 seconds.
Since the app is composed of elixir code and pg db, I tried to identify how time spreads among them.
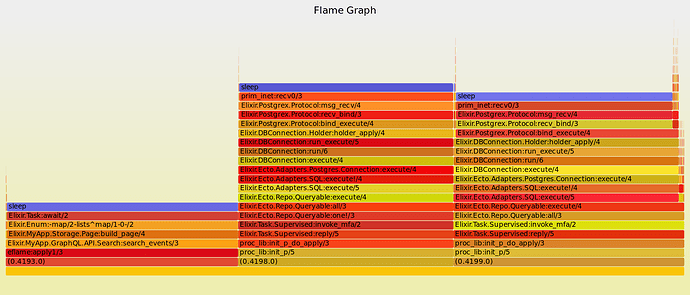
Thanks to incendium, I profiled the resolver responsible for the search :
I think I get what append : the main process launch two async tasks : one for the result page (select where order by offset limit) and one for the count. When tasks are over, results are serialized back to the caller.
From this flamegraph, it seems obvious that elixir code is doing nothing but waiting for the DB. So I activated the duration report for long queries in postgres.
I see that both queries are taking around 2" each. Even if they were done in sequence (hard to tell if it is the case or not), it tops to 4". So there is still 3" that I don’t understand where they are spent. I checked in the web browser, network part is only few ms.
Since I was not pleased with the time taken in the DB, I added some indexes. The time is now “1 for the page 2” for the count. The overall time decrease accordingly but I still have one to two sec that I don’t know where they are spent.
Any advise on how to further investigate ?
Regards


