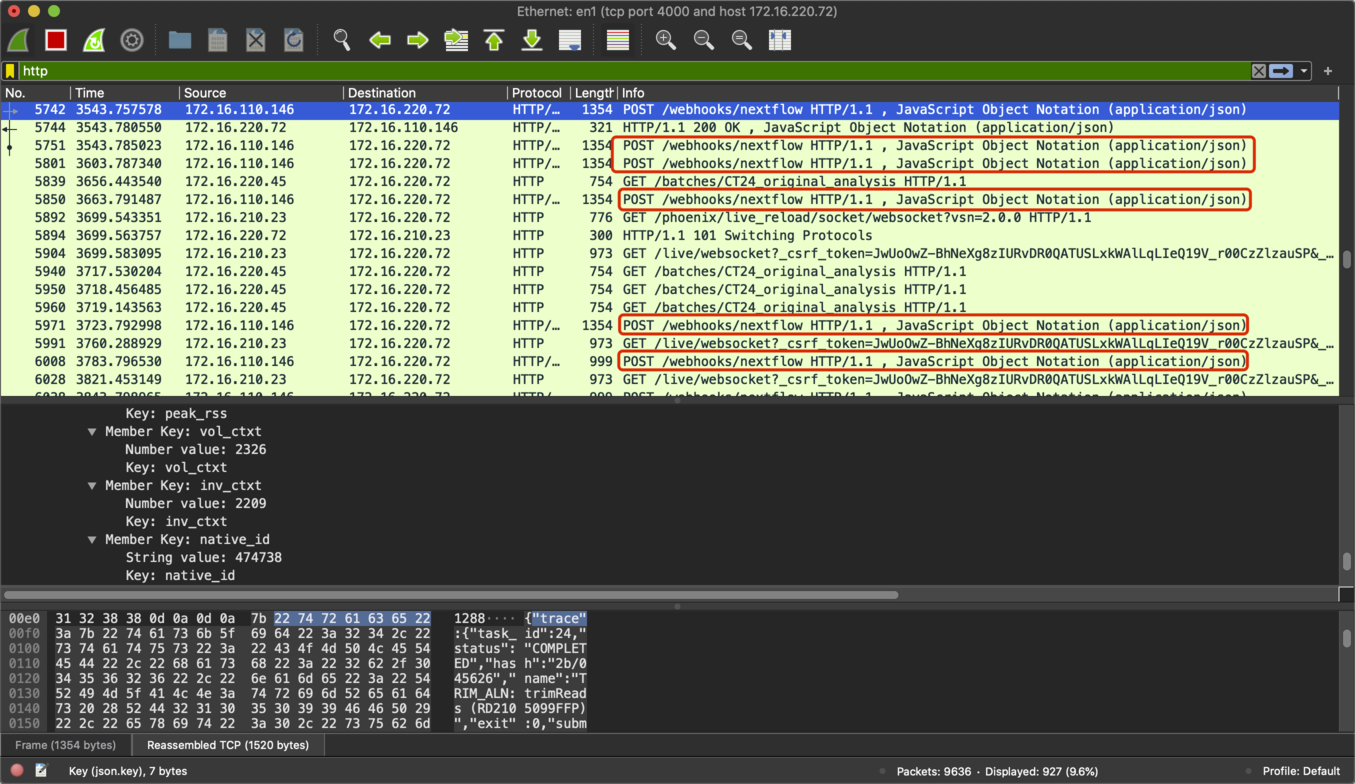
I use phoenix/elixir to write a mini-system that monitors the status of tasks that Nextflow (a workflow engine) starts. I called the system br-tower. Nextflow calls a web callback, i.e. webhook, I implemented when the state of a job changes. Most of these http requests can be handled by br-tower, but a few requests cannot. I use wireshark to capture the tcp packages Nextflow sends to br-tower, in order to find out whether such requests have any json payload or not. Surprisingly, they all have json payload. In the figure below, such requests are framed in red. Besides, http get requests in-between don’t get any response back. In the console where mix phx.server ran, only [info] POST /webhooks/nextflow was printed out, and no Parameters part follows. It is very weird. I will be very grateful, if someone could help me to solve this problem.
What you are doing is nothing out of ordinary. However, you may want to post more details, like console prints, router code, etc so other people can help you.
One thing I can think of is if you are posting from another origin, you need to make sure CSRF is not in your way. In any event, there should be error message in the console; no requests should be silently dropped.
@derek-zhou, Thank you!
the code for the router is listed below:
defmodule BrTowerWebuiWeb.Router do
  use BrTowerWebuiWeb, :router

  pipeline :browser do
    plug :accepts, ["html"]
    plug :fetch_session
    plug :fetch_live_flash
    plug :put_root_layout, {BrTowerWebuiWeb.LayoutView, :root}
    plug :protect_from_forgery
    plug :put_secure_browser_headers
  end

  pipeline :api do
    plug :accepts, ["json"]
  end

  scope "/", BrTowerWebuiWeb do
    pipe_through :browser

    live "/", PageLive, :index
    get "/batches/:id", BatchController, :show

  end

  scope "/api", BrTowerWebuiWeb do
    pipe_through :api

    get "/batches/:batch_id/items/:id", ItemController, :show
  end

  scope "/webhooks", BrTowerWebuiWeb do
   pipe_through :api

   post "/nextflow", WebhookController, :nextflow
  end

  if Mix.env() in [:dev, :test] do
    import Phoenix.LiveDashboard.Router

    scope "/" do
      pipe_through :browser
      live_dashboard "/dashboard", metrics: BrTowerWebuiWeb.Telemetry
    end
  end
end
The screenshoot for the console is pasted below. Please ignore the text labelled on the figure because I thought there was no payload, but in reality payload was there.

So what is the problem? you did receive payload.
Do you have an unit test that works all the times, or that fails too?
Check the docs to implement such a test if you don’t already know how.
The problem is http requests with payload were rejected silently by Plug and didn’t reach for the corresponding controller action.
I don’t have any unit test for this case till now.
when the weird case happened, the v2ray service (sort of a proxy) was on. I suspect that the v2ray service is most likely to be the culprit. I will report back if I can determine what the cause is.
In your log after the first POST /webhooks/next/flow, there is a Sent 200 in 1 ms so at least it worked for once. If subsequent requests are not handled, it is most likely a bug in your program so your controller hangs.
If Plug decided to reject any request for whatever reason, ther will be print in the console.
The screenshot shows only a very tiny part of log info. Post requests after the part worked normally. In addition, a few GET /batches/[:batch_id] didn’t work either. I think that this has nothing to do with the code for the controller action.
The following code snippet is about the controller and the related parser. I cannot find where the bug lies indeed.
defmodule BrTowerWebuiWeb.WebhookController do
  use BrTowerWebuiWeb, :controller

  alias BrTowerWebui.WeblogParser
  alias BrTower.Core.Batch

  @topic "batch:"

  def nextflow(conn, data) do
    case WeblogParser.parse(data) do
      {:error, msg} ->
        conn
        |> put_status(:bad_request)
        |> json(%{message: "Error: #{msg}"})
      event ->
        batch = BrTower.dispatch(event)
        case batch do
          {:error, msg} ->
            conn
            |> put_status(:not_found)
            |> json(%{message: "Error: #{msg}"})
          _ ->
            item_dtos = batch.items
            |> Enum.map(fn {k, _v} -> Batch.build_item_dto(batch, k) end)
            Phoenix.PubSub.broadcast(BrTowerWebui.PubSub, @topic <> "#{batch.id}", %{id: batch.id, items: item_dtos})
            json(conn, %{message: "Event received"})
        end
    end
  end
end
defmodule BrTowerWebui.WeblogParser do
  alias BrTower.Core.Events.{BasicInfo, TaskInfo, PipelineStarted, PipelineCompleted, PipelineErrorOccurred, TaskSubmitted, TaskStarted, TaskCompleted}

  def parse(%{"runName" => run_name, "event" => event, "utcTime" => utc_time_str} = data) do
    run_id = Map.get(data, "runId")
    {:ok, utc_time, _} = DateTime.from_iso8601(utc_time_str)
    basic_info = BasicInfo.new(run_id, run_name, utc_time)

    case event do
      "started" ->
        batch_id = get_in(data, ["metadata", "parameters", "id_for_tower"])
        session_id = get_in(data, ["metadata", "workflow", "sessionId"])
        analysis_type = get_in(data, ["metadata", "parameters", "analysis_type"])
        mode = get_in(data, ["metadata", "parameters", "mode"])
               |> String.to_atom()
        case batch_id do
          nil ->
            {:error, "batch_id is missing"}
          _ ->
            PipelineStarted.new(basic_info, session_id, batch_id, analysis_type, mode)
        end
      "completed" ->
        batch_id = get_in(data, ["metadata", "parameters", "id_for_tower"])
        success = get_in(data, ["metadata", "workflow", "success"])
        analysis_type = get_in(data, ["metadata", "parameters", "analysisType"])
        case batch_id do
          nil ->
            {:error, "batch_id is missing"}
          _ ->
            batch_id = if is_nil(analysis_type), do: batch_id, else: "#{batch_id}_#{analysis_type}"
            PipelineCompleted.new(basic_info, batch_id, success)
        end
      "error" ->
        trace = Map.get(data, "trace")
        case trace do
          nil ->
            PipelineErrorOccurred.new(basic_info, nil)
          _ ->
            task_info = build_task_info(trace)
            case task_info.item_id do
              nil ->
                {:error, "item_id is missing"}
              _ ->
                PipelineErrorOccurred.new(basic_info, task_info)
            end
        end
      x when x in ["process_submitted", "process_started", "process_completed"] ->
        trace = Map.get(data, "trace")
        task_info = build_task_info(trace)
        case task_info.item_id do
          nil ->
            {:error, "item_id is missing"}
          _ ->
            case x do
              "process_submitted" ->
                TaskSubmitted.new(basic_info, task_info)
              "process_started" ->
                TaskStarted.new(basic_info, task_info)
              "process_completed" ->
                TaskCompleted.new(basic_info, task_info)
            end
        end
    end
  end

  def parse(data) do
    {:error, "invalid data: #{data}"}
  end

  defp build_task_info(trace) do
    process_name = Map.get(trace, "process")
    item_id = Map.get(trace, "tag")
    status = trace
             |> Map.get("status")
             |> String.to_atom
    TaskInfo.new(process_name, status, item_id)
  end
end
Other people cannot help you debug your code unless you can make a minimum reproducible case and put it on github.
Elixir gives you many tools to debug; you have a console, a remote iex shell, even a live dashboard. Also you will need to have some faith in Phoenix; it is much more likely the bug is in your side.
In my log, [info] POST /webhooks/nextflow was output by the Plug.Logger, and [debug] Processing with BrTowerWebuiWeb.WebhookController.nextflow/2 … was output by the phoenix_router_dispatch_start in the Phoenix.Logger. phoenix_router_dispatch_start is installed as the event handler for [:phoenix, :router_dispatch, :start]:
https://github.com/phoenixframework/phoenix/blob/60da3f0dc01b7e0eae0e5bd608431ead953ded5d/lib/phoenix/logger.ex#L128
This means dispatching a request to the corresponding controller action was not started because the related debug line was missing in my log, so I can conclude that this case is not caused by the bug that perhaps exists from my controller part.
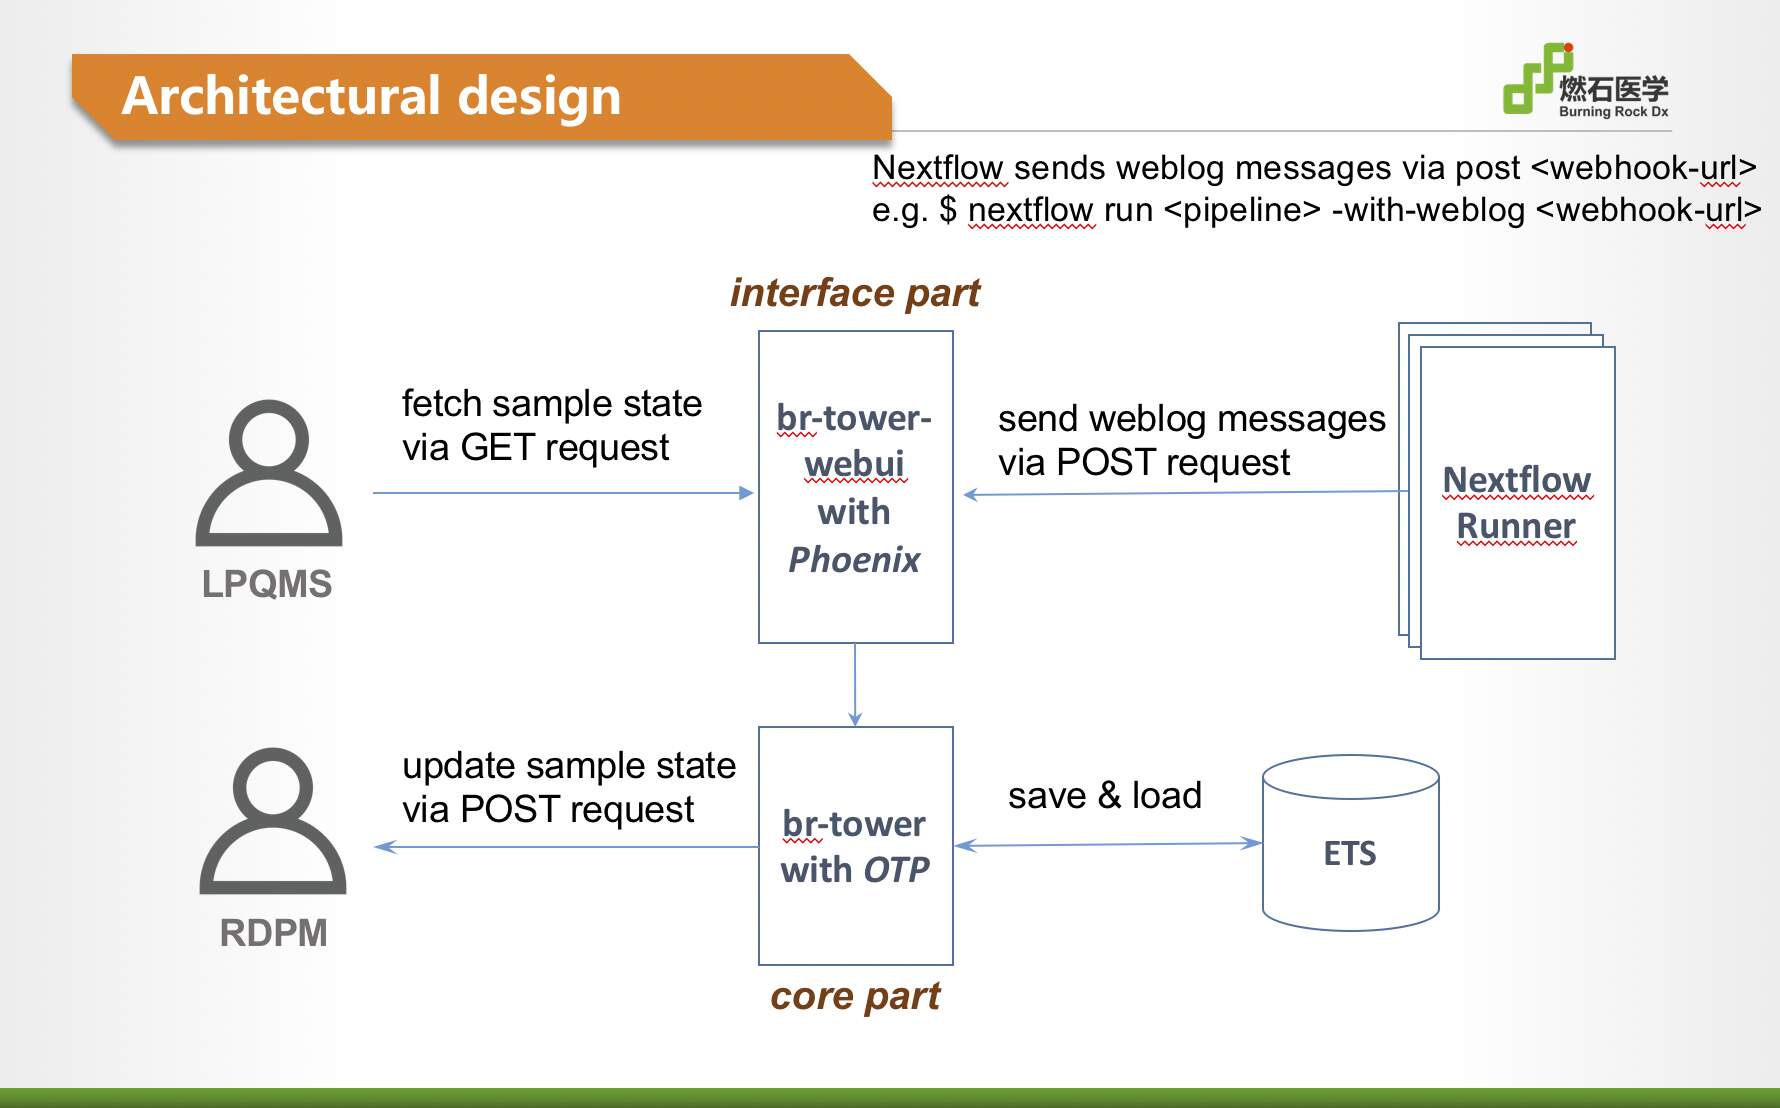
Sorry, I cannot put my code on github because of the policy of our company, but i can give you the architectural design which is shown in the following figure:
Or, alternatively, the function you attached to :phoenix_router_dispatch_start has a problem and Telemetry removed it after that first invocation:
If the function fails (raises, exits or throws) then the handler is removed
I would start by putting some debug logs in the controller itself; Telemetry is perhaps not the best tool to rely on for debugging.
From another topic discussion I found a link to this one(posted by @axelson) and there Cowboy may be the culprit:
You may want to check if it relates with your problem or not.
The flowchart is nothing out of ordinary. The devil is in the details, as always.
After one-week investigation that includes testing and tracing with Extrace, I found that the Cowboy http server hung from a random time point due to an unknown reason, the subsequent requests were rejected in somewhere whether it is a GET request or a POST request, even a GET / request for the home page. The “This site can’t be reached” message was shown in a browser. Tracing indicates that handling stops before going into the router. Such hanging lasts in some cases for a short time such as 5 mins, in other cases for a long time such as 40 mins. After hanging the system works again. What magic can break the Cowboy down? Is it ETS?
Just a wild guess…
If swap is enabled in your Linux server I would suggest you to try to disable it or at least monitor if when this issues happen your server is using swap.
I would imagine that when swap is being used that things just run much slower, not to hang, but we see so many weird things happening in our life’s as developers that in my opinion it will not hurt to try to explore the swap possibility.
Thank you for your advice. br-tower is developed and tested on my Hackintosh ( Intel NUC Hades Canyon).
Mac’s also seem to use swap files, thus I guess that an Hackintosh will also use it?
Disable/Enable swap on Mac:
If I were you, I will put all instrumentation methods I can think of on the system, for both the OS and BEAM. Then analysis when this thing happen, is there anything unusual also happening. Then post here with your finding.
Tricky bugs are rarely solved by taking wild guesses and shooting in the dark. You need data and evidences, and lots of it.
The culprit is max open files per os process. It is set to 256 by default on MacOS Catalina. When it is changed to 4096, there is no hanging anymore. But I cannot identify the location where the cow_boy server waits for any available file descriptor to establish the TCP connection.
Because it isn’t done by Cowboy, but by Ranch. And it probably doesn’t wait in Erlang code, it just call the OS to provide one for them via gen_tcp:accept/2.


