Hi!
We’ve noticed that the Phoenix PubSub process in our application is often using more than 300MB of memory. Is that expected in fairly large applications or would that be a sign of a memory leak?
Do you have any suggestions on how to proceed to investigate the issue and identify what exactly it’s causing the process to use that much memory? Thanks in advance!
Here are all the details I could fetch from the Phoenix Dashboard:
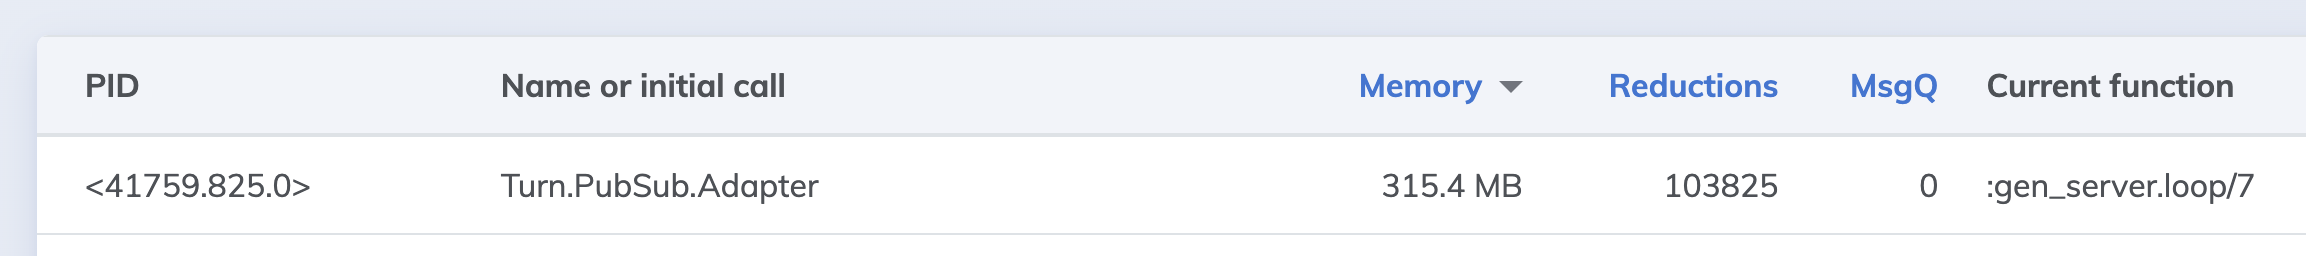
Registered name: Turn.PubSub.Adapter
Current function: :gen_server.loop/7
Initial call: Phoenix.PubSub.PG2Worker.init/1
Status: :waiting
Message queue length: 0
Total heap size: 40069502
Heap size: 1727361
Stack size: 11
Reductions: 211397390
Garbage collection:
{:max_heap_size,
 %{error_logger: true, include_shared_binaries: false, kill: true, size: 0}}
{:min_bin_vheap_size, 46422}
{:min_heap_size, 233}
{:fullsweep_after, 65535}
{:minor_gcs, 2347}

Suspending: []
Current stacktrace:
(stdlib 5.2.3) gen_server.erl:1001: :gen_server.loop/7
(stdlib 5.2.3) proc_lib.erl:241: :proc_lib.init_p_do_apply/3
We are using phoenix_pubsub v2.1.3 with the default PG2 adapter.


