Profiling Phoenix Liveview

I upgraded LiveView from 0.15.4 → 0.17.7 in March. I recently noticed that the duration has doubled from 35 to 70 ms since March which is quite confusing to me.

However, this could be caused by a few things:

  • upgrading from 0.15.4 → 0.17.7
  • a server change, however, it was moved to a beefier server
  • preparing for localization and adding a great deal of gettext usage

I attempted to profile in several ways, but can’t seem to instrument the right place.

  • incendium uses eflame which uses :erlang.trace. Using master so that it works on newer phoenix, I added the decorator in various places:
    • controller - works as expected. Elixir.Phoenix.Controller:render_and_send, Elixir.Plug.Conn:send_resp
    • liveview mount - only shows the function
    • liveview handle_params - only shows the function
    • render - does not work - gives only :eflame.stop_trace, :eflame_trace, :erts_internal_trace
    • router scope - does not work
    • in app/lib/app_web.ex - decorating controller or view doesn’t work.
  • I tried Profiler which uses :fprof under the hood and couldn’t get a useful trace either.

Anyone have ideas?
1 Like

70ms is the latency time experienced by the browser, or the time on this server from your existing profiling? Does your app hit the DB? If you moved servers, the network could explain the difference, but we have too little information to say where the time is spent. It’s very unlikely to be anything LV 0.15 vs 0.17 related.

3 Likes

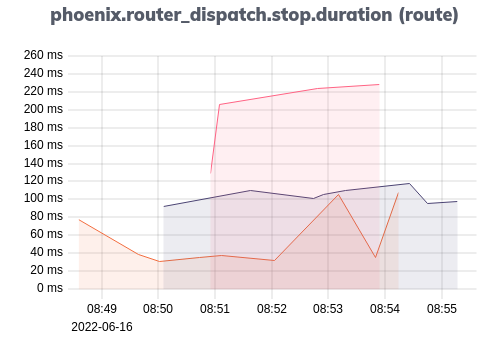
The duration of first render server side increased from 35ms to 70ms.

The DB is on the same node, just changed from 1GB shared cpu to 4GB and dedicated cpu.

So there shouldn’t be any network involved here.

image

I swear, the purple line used to twice as fast. And the server logs agree with me.

I’m having trouble believing it could be gettext adding 30ms and I don’t recall adding any new features in the past 3 months that could do this. Any hints on getting a profiler on the full scope of the initial page render? Otherwise, I have to do this the really, really old-fashioned way and start ripping parts of the page out / rollback / etc.

Not sure what your setup is with your application…but you may want to set up PromEx and enable the LiveView plugin (prom_ex/phoenix_live_view.ex at master · akoutmos/prom_ex · GitHub). You’ll get some good insight into the time spent in the mount and handle_event callbacks.

If you can deploy Prometheus and Grafana, it may be worth while rolling back (if you can) and collecting some metrics under load and then redeploying and seeing if the behavior changes (under similar load). PromEx also has an Ecto plugin and that can also be useful so you can ensure that your DB interactions are not the problem.

3 Likes

I have structured logging with the durations of handle_event and also the data from plug.logger. The liveview that I’m interested for the rendering performance has no database component.

So imagine, the initial page rendering is based on a random number. Then afterwards, you can click on a button which will generate another random number and refresh the page. I’m noticed this when I setup metrics a year ago that the duration on a handle_event is ~10 ms, however, the duration on a mount is ~50ms (or now 100ms).

The same issue arises where I can’t seem to find a place to hook to see the performance of the entire request from handle_params/handle_event thru to the render(assigns).

It’s not clear to me where and how to get that information other than rolling back and other manual comparison steps with adding/removing code to determine the hotspots?

Curious if anyone has any insight into this behaviour.

On mount:

13:06:47.025 request_id=FwA9R6sVowyxKmQAAFhC [info] [{"duration", 1111.837098}, {"event", "basic_data"}, {"status", 200}]
13:06:47.038 request_id=FwA9R6sVowyxKmQAAFhC [info] [{"duration", 1185.018558}, {"event", "handle_params"}, {"status", 200}]
13:06:47.218 request_id=FwA9R6sVowyxKmQAAFhC [info] [duration: 1377.664, status: 200, params: %{}, path: "/", method: "GET"]

Websocket connect/update (basic_data has cached elements)

13:06:47.925 [info] [{"duration", 292.594243}, {"event", "basic_data"}, {"status", 200}]
13:06:47.930 [info] [{"duration", 377.007019}, {"event", "handle_params"}, {"status", 200}]

After connection, doing a full page update via phx-click (no caching of basic_data)

13:07:17.512 [info] [{"duration", 8.274046}, {"event", "basic_data"}, {"status", 200}]
13:07:17.512 [info] [{"duration", 13.654211}, {"event", "click event"}, {"params", %{"bla"}}, {"status", 200}]

I’m not sure why the performance is so different after the websocket is connected? The initial connection is 100x slower for basic_data. For reference, basic_data is a pure function but the input to it could be cached.

Also, is in dev, not prod, so I’m not sure if that makes a difference.

I can’t explain a difference of 1000ms to 9ms easily for the same function being run with almost identical inputs (to make sure it isn’t cached).

Anyone have any ideas?