PromEx - Prometheus metrics and Grafana dashboards for all of your favorite Elixir libraries

Prometheus metrics and Grafana dashboards for all of your favorite Elixir libraries

Hex.pm GitHub Workflow Status (branch) Coveralls github branch

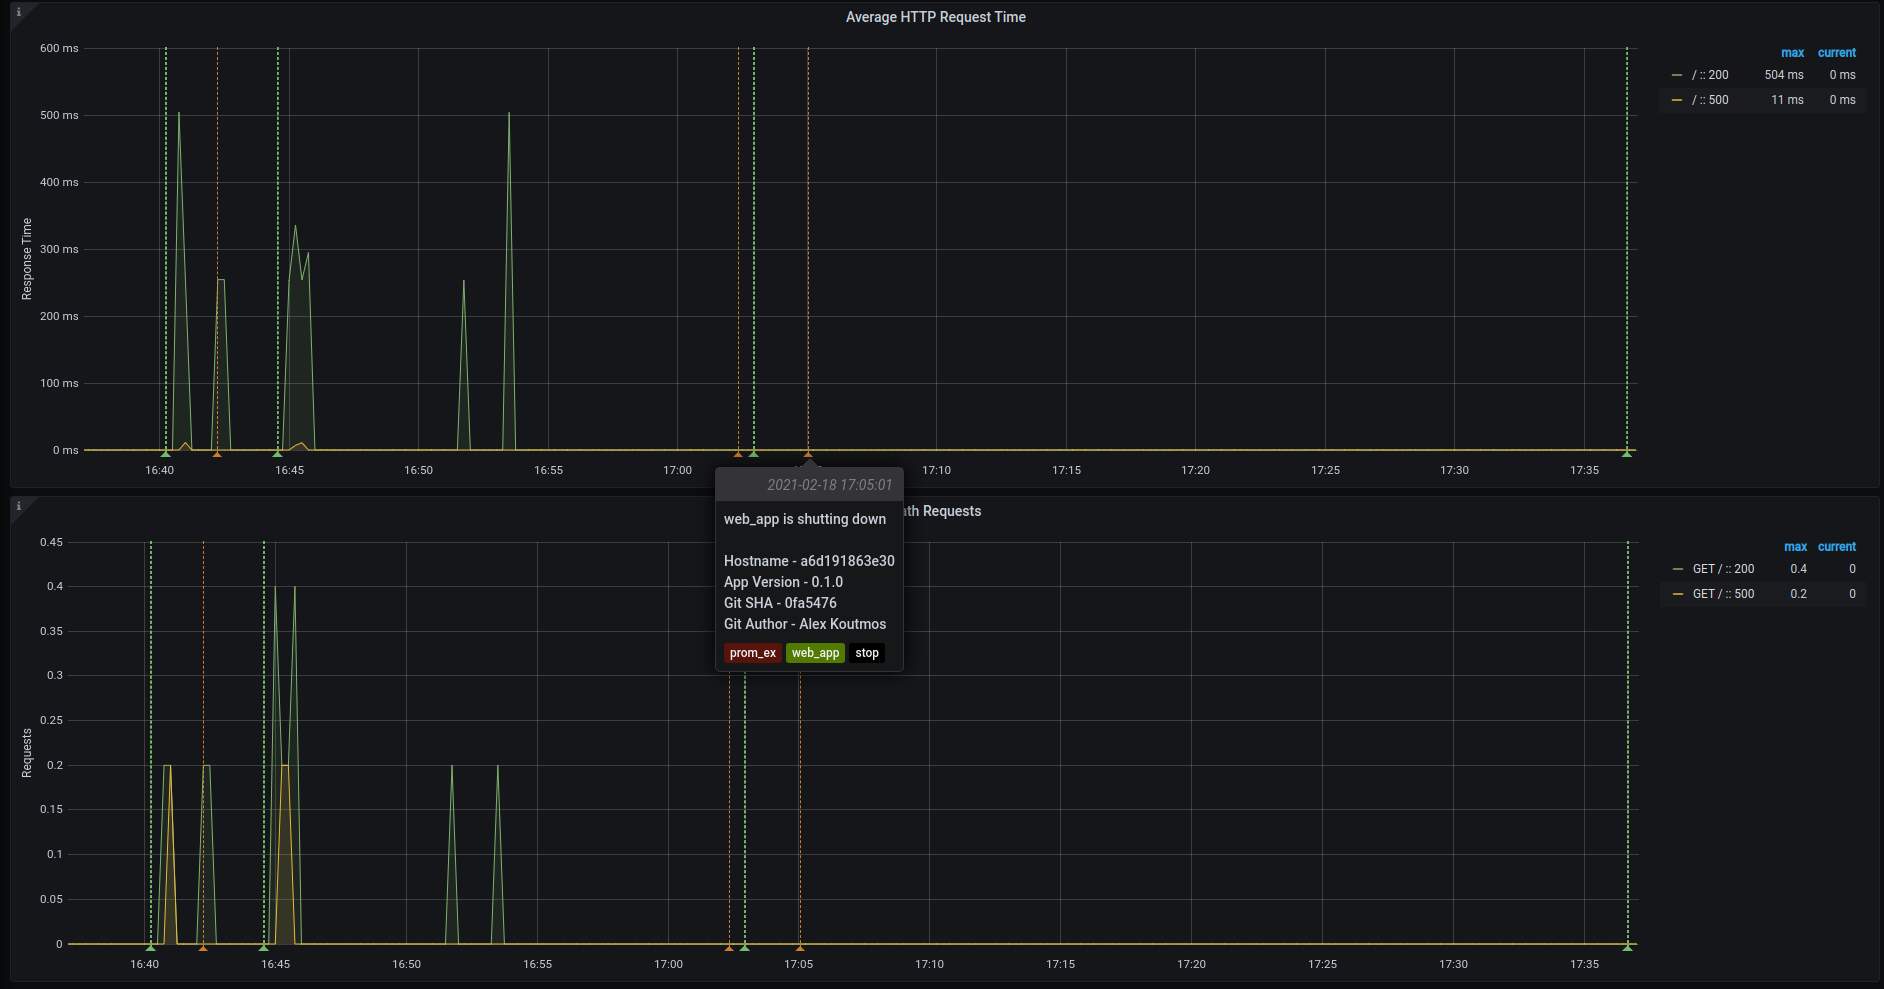
I have been putting off creating an ElixirForum post about PromEx until it hit the coveted 1.0.0 mark. But that time has finally come! PromEx is a metrics framework that ties together all of the BEAM Telemetry libraries in a simple to use package. It comes with plugins for all of the popular Elixir ecosystem libraries including Phoenix, Ecto, LiveView, Oban, the BEAM itself, and may more coming soon. Each PromEx plugin also comes with an accompanying Grafana dashboard which PromEx will automatically upload for you on application start. PromEx will also annotate all of your PromEx Grafana dashboards so that you know when application instances come up and go down:

PromEx is extensible in that it also allows you to write you own plugins and dashboards to support gathering metrics specific to you application.

Check out the thorough Hex Docs to learn more about PromEx Contents — PromEx v1.0.0
And Check out the snapshots of the dashboards if you are curious what you get out of the box Dashboards Screenshots — PromEx v1.9.0

32 Likes

Thanks for this awesome library :smiley:

I gave a quick look into the docs and it looks like the endpoint to get the metrics is public, instead of private, aka is not protected with a token or behind authentication. Am I wrong in my assumption?

1 Like

Great question! The metrics plug that comes with PromEx has no authorization configuration available since I have another library that I maintain that deals with things like that. I will probably pull in authorization into the builtin plug since it is a common request in the near future. But for now I recommend people use Unplug which can unhook plugs from your plug pipeline.

PromEx is currently capturing metrics for The Changelog and you can look at how they secure the metrics endpoint using Unplug:

4 Likes

First, I want you to know that I work as a Developer Advocate in API Security, just to put you in context why I am so picky with insecure software by default.

In my opinion developers of any of software should consider security as op-out not opt-in.

Users of any software, be them also developers or end users should not have to learn how to secure them, instead they should have to learn how to disable security if that is really what they want.

But at least I am glad that you are open to make it secure by default, aka security as opt-out.

The docs should make very clear, and in BOLD, that the endpoints are public and not protected. Remember that attackers leverage all they can to build attacks based on chains of everything that they can leverage from the target, be them metrics, logs, too much info in the request response, etc.

1 Like

Totally see where you are coming from on this and honestly I have very similar feelings.

Unfortunately, Prometheus has security as opt-in (i.e you can configure a scrape target without specifying any kind of auth configuration), and in most of the production deployments I have seen, prom, grafana and the scrapable apps are all behind a load balance in their own VPN and metrics endpoints are usually filtered out at the load balancer layer and wide open on the intranet.

I wanted to make sure that PromEx didn’t introduce a barrier to entry by forcing authorization, hence my decision not to have auth as a default (for now at least). I cover authorization in the PromEx.Plug documentation (PromEx.Plug — PromEx v1.0.0) but agree that I should probably have a section right in the readme to address security concerns just like i had a section to address performance overhead concerns.

Thanks for the feedback! Appreciate it :slight_smile:

3 Likes

That['s exactly the mentality that needs to change in our industry and while it prevails we will never have a more secure internet.

You even have a search engine to find all software exposed to the internet:

https://shodan.io

Search for prometheus:

https://www.shodan.io/search?query=prometheus

Search for Grafana:

https://www.shodan.io/search?query=grafana

In the results just check the ones that return a 200 response and they are some that are just opne, and that happens because software by default is insecure, instead of being secure.

And why not making this plug required in the installation of PromEx and then have this section showing how to remove it for the ones that don’t want security by default?

3 Likes

Not all applications that expose metrics leverage Phoenix (think like a Broadway+RabbitMQ job worker). As a result it wouldn’t be feasible to couple the metrics to the Plug.

I don’t know your library in detail, but if exposes an endpoint to the public then I am of the opinion that it should be secure.

Now, when consumed internally by another code, the obviously it doesn’t need to perform authentication.

Version 1.0.1 of PromEx has been published to Hex

This release includes mostly documentation fixes and a minor bug fix to the Oban plugin. Give it a whirl!

5 Likes

@akoutmos Thanks for the awesome library! I’m replacing our previous prometheus setup with it, but I’m running into some odd failing tests in various areas (Ecto and Phoenix LiveView for example). Is it possible to disable PromEx during testing?

@akoutmos After further investigation, the test failures seem to be caused by some other dependency updates I applied when installing PromEx, so don’t seem to be related at all. Thanks for all your hard work on this excellent library!

Version 1.2.1 of PromEx has been published to Hex

This release contains an important bug fix for Phoenix applications using the forward macro.

Version 1.3.0 of PromEx has been published to Hex

This release contains:

  • The new Absinthe plugin and dashboard
  • BEAM plugin updates to capture metrics for persistent_term
  • A bug fix for later version of LiveView where the LiveView module could not be resolved (backwards compatible)
1 Like

Version 1.4.0 of PromEx has been published to Hex.

Changelog for this version:

Changed

  • The Phoenix plugin now requires an :endpoint configuration option to be passed to it containing the module
    for which metrics will be captured.

Added

  • Plug.Router plugin and dashboard.
  • PlugCowboy plugin and dashboard.
  • Phoenix plugin now supports multiple routers and multiple endpoints.
  • Phoenix plugin and dashboards now contains endpoint configuration data.
  • Phoenix plugin now captures socket metrics (dashboard not yet updated though).
  • Ecto plugin captures total_time metrics (dashboard not yet updated though).
  • Add an optional configuration to dashboard renderer and each plugin so that the metrics_prefix can be altered.

Fixed

  • Oban dashboard overview stat panels.
6 Likes

Version 1.4.1 of PromEx has been published to Hex

Changelog for this version:

Added

  • Added a configuration to the dashboard assigns so that the default time interval can be specified
    by the user as opposed to being hard coded to 30s.

Fixed

  • Fixed Plug.Router plugin to handle requests without conn.private.plug_route info

Version 1.6.0 of PromEx has been published to Hex

Changelog for this version:

Added

  • Updated BEAM plugin to surface JIT support
  • Broadway metrics plugin
  • Broadway Grafana dashboard

Fixed

  • LiveView plugin would detach exception handles when certain errors were encountered

Here is a snapshot of the Broadway dashboard:

4 Likes

Version 1.7.0 of PromEx has been published to Hex

This is a really exciting release as PromEx now allows you to bundle GrafanaAgent so that you can push metrics to a Prometheus instance via remote_write. That means that you can get up and running with services like GrafanaCloud in minutes! Imagine that, metrics and dashboards all up and running in 15 minutes :clinking_glasses:. Enjoy!

Changelog for this version:

Added

  • Added ability to execute arbitrary function on resulting dashboard for user customization.
  • The GrafanaClient is now considered part of the public API, and users can interact with Grafana directly. For example, users can publish their own Grafana annotations in addition to the annotations provided by PromEx.
  • Added the ability to start GrafanaAgent via a port so that metrics can be published via remote_write to an other Prometheus instance. For example, if you are using GrafanaCloud, you can use PromEx to push metrics right to GrafanaCloud using the appropriate configuration. This feature is currently only available for Linux and OS X.
  • The ETSCronFlusher GenServer can now be configured to flush the ETS buffer at whatever time interval you desire. The default is still every 7.5s.

Fixed

  • Broadway metrics prefix.
  • Broadway dashboard panel descriptions and titles.
  • Fixed the :default_selected_interval option in all dashboards.
  • Phoenix plugin manual metrics were ignoring the metric prefix option.

Changed

  • Application plugin no longer logs warnings for missing GIT env vars.
  • LifecycleAnnotator no longer logs warnings for missing GIT env vars.
  • All plugin distribution buckets have been redefined. The reason for this being that prior to PromEx 1.7, some of the distribution buckets were a bit wasteful and were not adding value in terms of metrics data points. With this change,
    users should notice a decline in data point cardinality without compromising resolution.
  • Application plugin has changed how it fetches dependency information. It is now using Applciation.spec/1 to get the list of applications that are started with your application. This should reduce noise in the Grafana dashboard as all
    the default OTP and Elixir applications will not show up.
  • All Grafana dashboard now have a default panel sort order where the largest timeseries plot is first in the list when hovering over the visuals.
  • All Grafana dashboards now filter the instance filter based on the selected job filter.
  • The Oban plugin no longer collects metrics related to :circuit events as those have been removed from Oban starting with version 2.11 (Lock based leadership by sorentwo · Pull Request #606 · sorentwo/oban · GitHub). The Oban dashboard will be updated in the next release to remove the unused panels.
4 Likes