Playfair (named after: William Playfair) is a data visualization/plotting library with the goal of being able to produce publication-quality figures without the use of any other tools. Because producion publication-quality figures always entails some manual adjustments, Playfair aims to be very customizable. When picking between convenience/terseness or customizability, Playfair will often choose customizability. Playfair doesn’t draw anything directly. Instead, it uses the typst typesetting system as a backend, through the interface provided by ExTypst.
Currently it only supports boxplots (and the boxplots don’t even show the outliers outside the whiskers because I haven’t implemented that part yet). I’ve decided to implement boxplots before more basic plots such as scatter plots becuase boxplots are actually quite complex.
The library is under very active development and APIs might changes without warning. Don’t use this for anything serious yet.
Some example code:
XYPlot.new()
# Data is generated somehwere else in the code
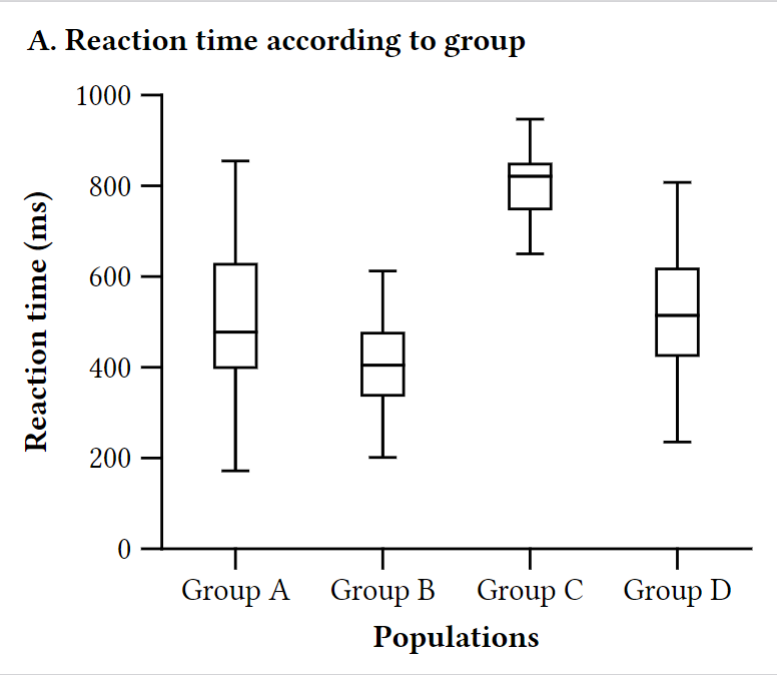
|> BoxPlot.plot("x", "y", data())
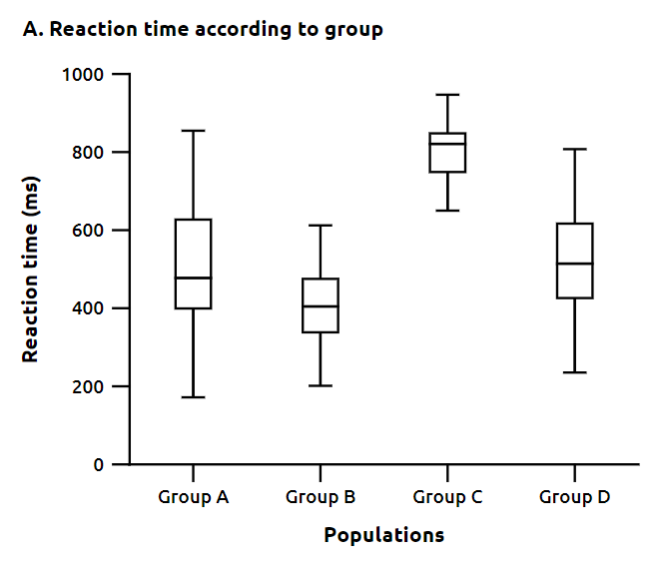
|> XYPlot.put_title(Typst.raw("strong()[A. Reaction time according to group]"))
|> XYPlot.put_axis_label("y", Typst.raw("strong()[Reaction time (ms)]"))
|> XYPlot.put_axis_label("x", Typst.raw("strong()[Populations]"))
# Drop the spines for the X2 and Y2 axes (you can also remove those axes instead)
|> XYPlot.drop_axes_spines(["x2", "y2"])
|> XYPlot.render_to_pdf_file!("examples/box-plot-example-without-spines.pdf")
Generated figure (converted from PDF to PNG because ExTypst can’t generate PNG or SVGs directly, althougn I believe typst itself can):
The code is inspired by Python’t Matplotlib but with a more functional style. The goal is to provide all the plot types and general functionality provivded by matplotlib except for the interactive parts. I’m open to support animatinos by generating multiple frames and then gluing them together, but it’s definitely not a priority.
Issues (so far!)
Unlike Matplotlib, it’s not yet possible to have more than one plot in the same figure (Playfair doesn’t even have the notion of a figure), but that’s actually quite simple to implement using typst as a backend (we can just reuse the native typst layouts to compose plots together).
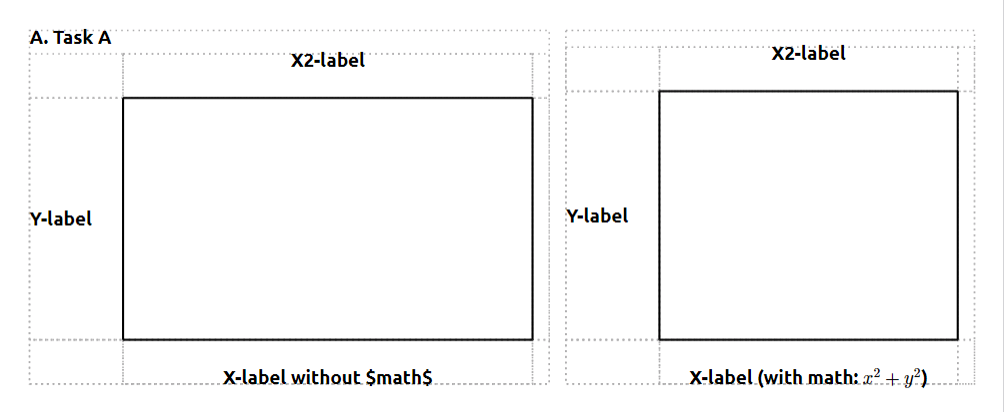
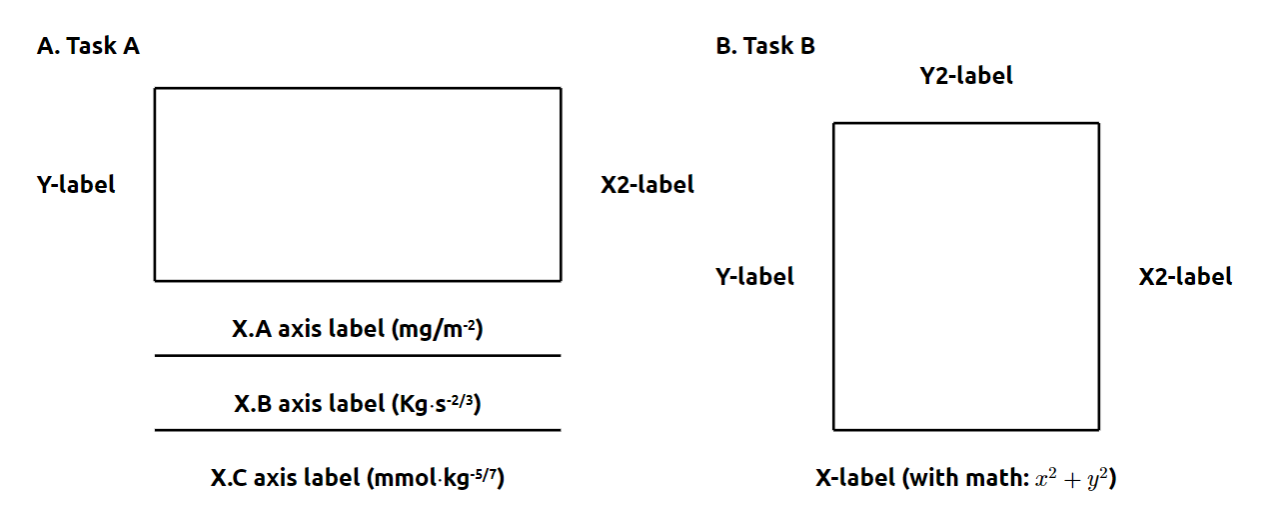
The main issue with Playfair right now is that it isn’t easy to draw arbitrary content in the labels area, for example (you might want that if you’re doing some survival analysis with Kaplan-Meier curves and want to draw a table with the “at risk” counts below the x-axis ticks). In all fairness, this is something with which even Matplotlib strugles a lot. Most of the interesting functionality requires some kind of constraint solver (even a linear solver employing something like the simplex method would probably be enough for most cases), and it’s hard to provide an interface which makes it natural to draw something AND which is compatible with the way constraint solvers like to work.
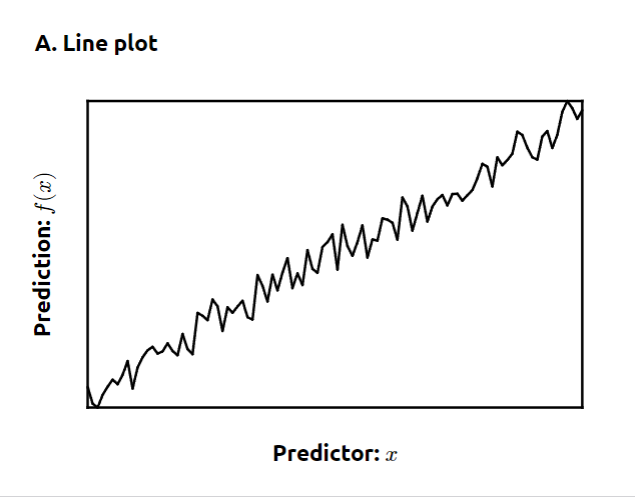
Another problem with trying solve constraints intelligently is that we actually need the backend (i.e. typst) to evaluate the object sizes (the Elixir part has no idea how text is rendered, or even worse, how mathematical formulas are rendered!), and this means that a lot of the constraint solving must happen inside typst, instead of calling an optimized constraint solver.