Slow Ecto queries

Hey guys. I’m new to Elixir.
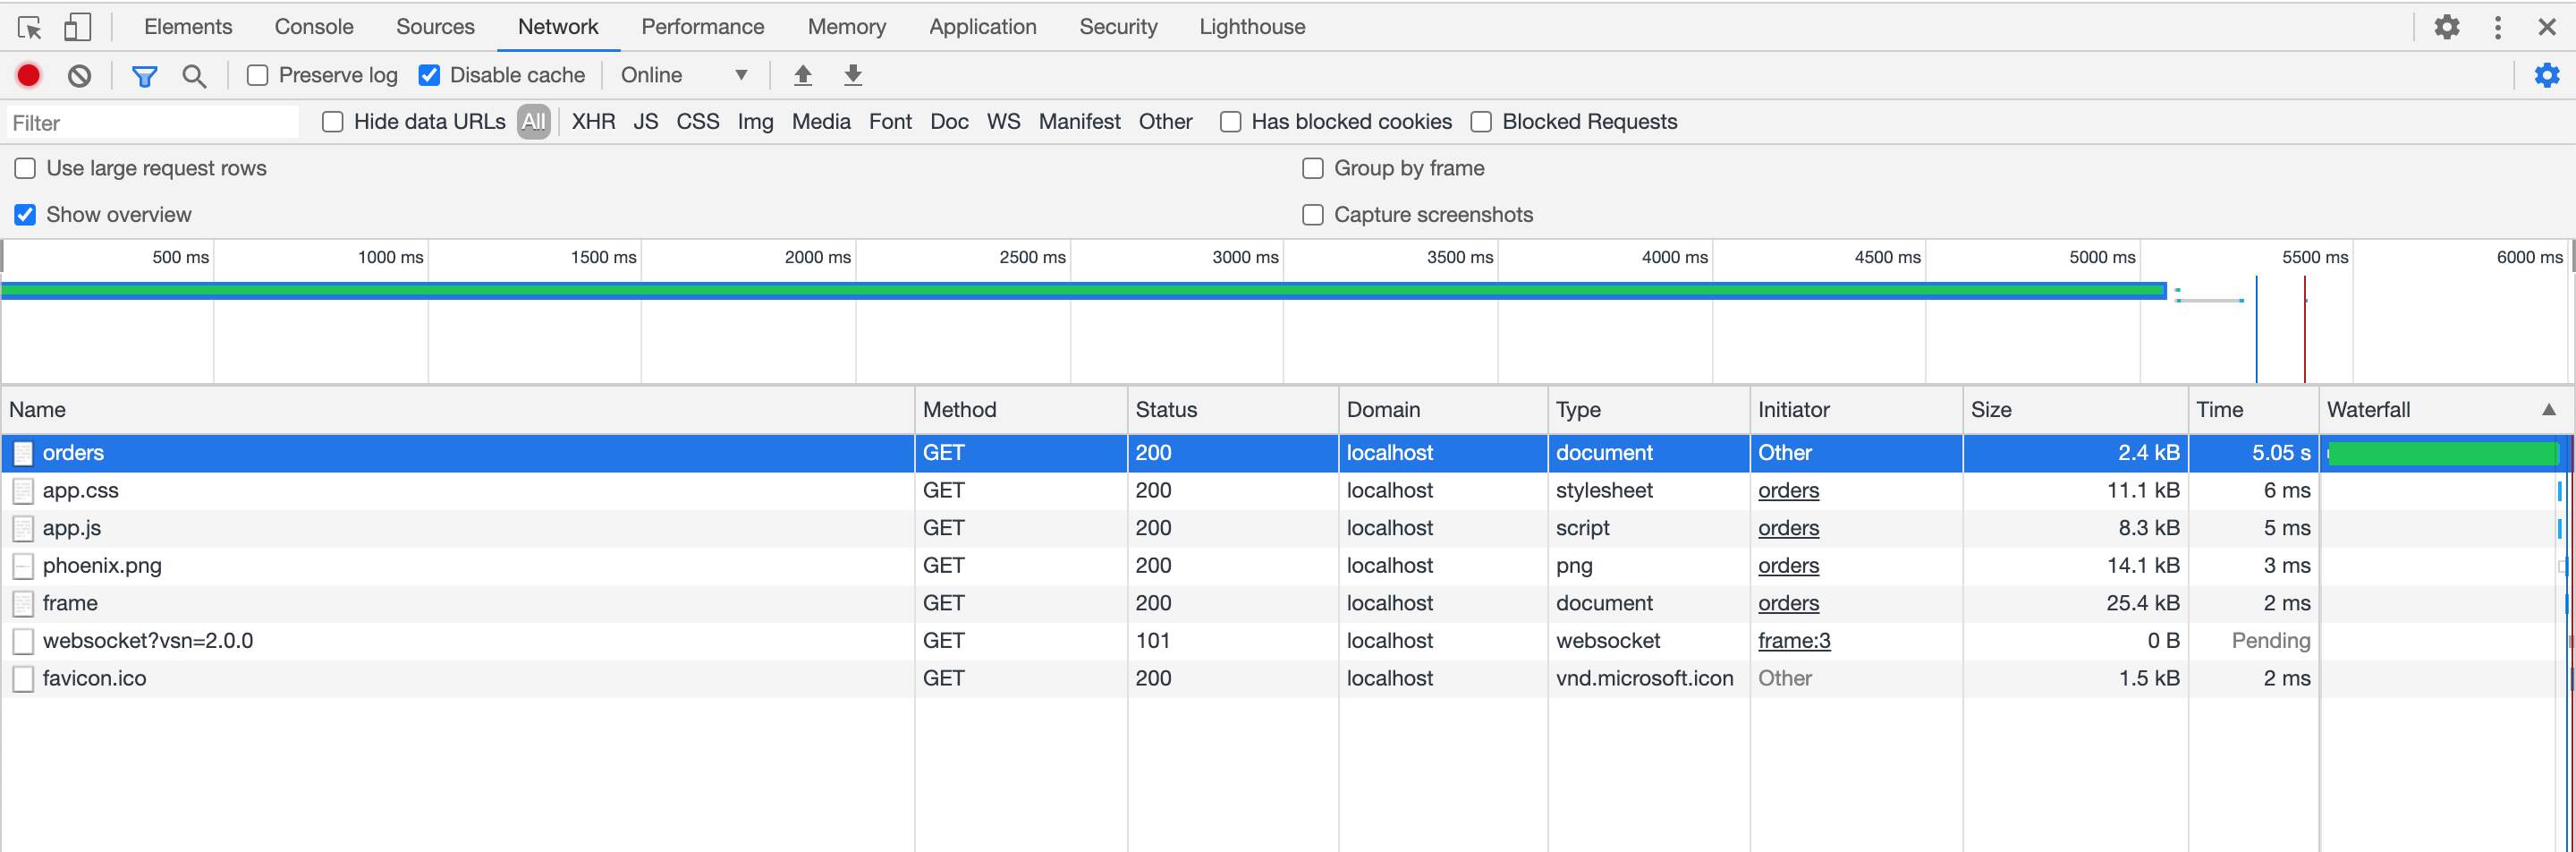
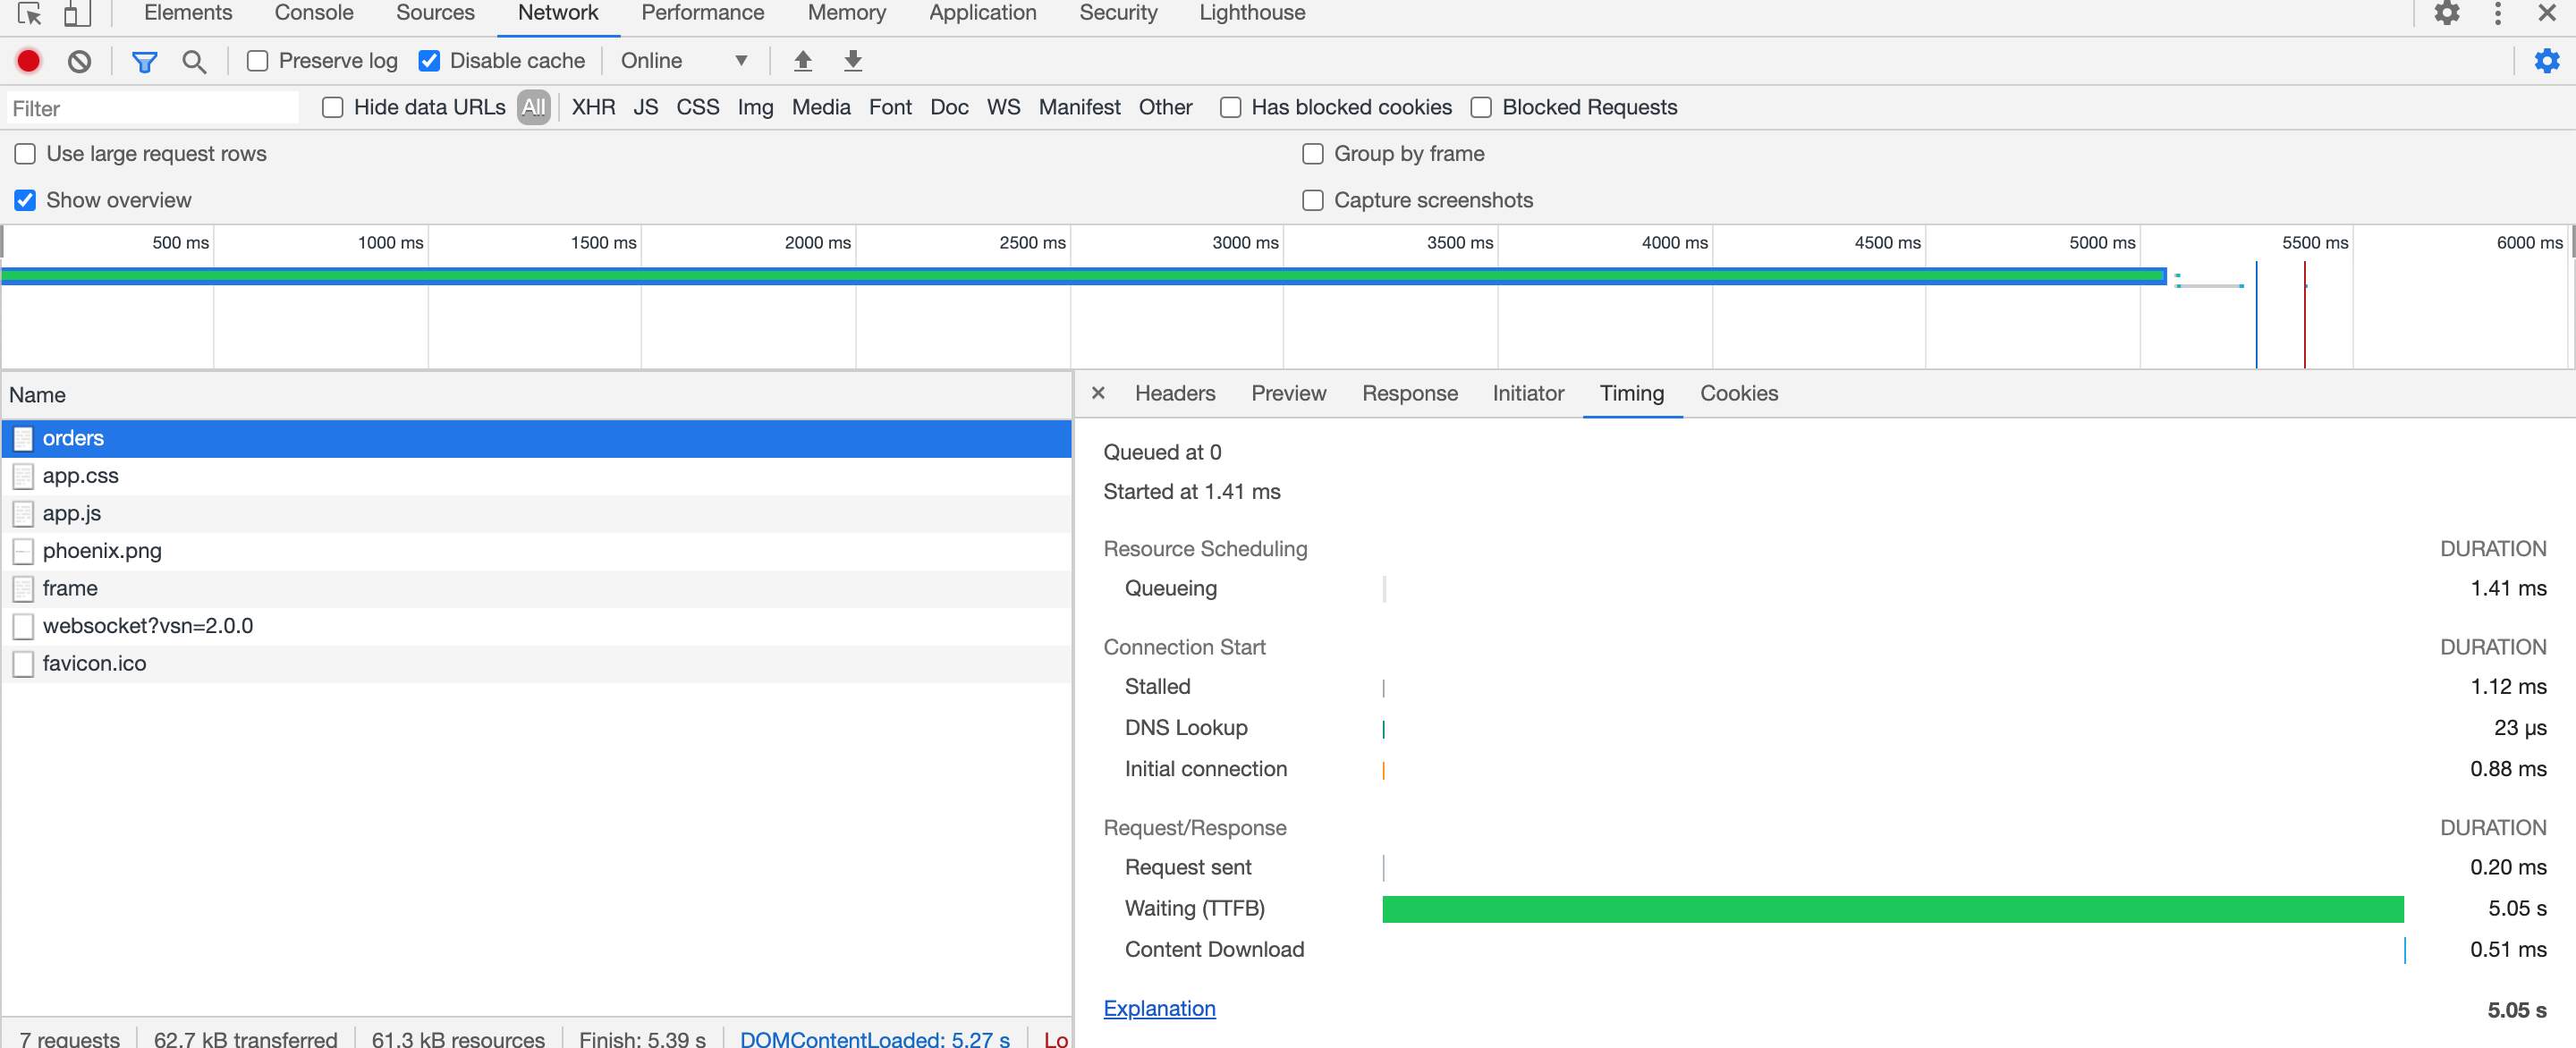
I made a simple app with users and orders and the page takes 5s to load. I suspect it’s because

Here is request log:

[info] GET /orders

[debug] Processing with ReviewsWeb.OrderController.index/2

Parameters: %{}

Pipelines: [:browser, :protected]

[debug] QUERY OK source="orders" db=4.8ms idle=18.4ms

SELECT o0."id", o0."asin", o0."purchase_date", o0."review_deadline_date", o0."review_link", o0."owner_id", o0."reviewer_id", o0."status_id", o0."problem_id", o0."type_id", o0."inserted_at", o0."updated_at" FROM "orders" AS o0 []

[debug] QUERY OK source="users" db=6.1ms idle=23.5ms

SELECT u0."id", u0."password_hash", u0."email", u0."inserted_at", u0."updated_at", u0."id" FROM "users" AS u0 WHERE (u0."id" = $1) [1]

[info] Sent 200 in 19ms

[info] GET /orders

[debug] Processing with ReviewsWeb.OrderController.index/2

Parameters: %{}

Pipelines: [:browser, :protected]

[debug] QUERY OK source="orders" db=2.3ms idle=1587.6ms

SELECT o0."id", o0."asin", o0."purchase_date", o0."review_deadline_date", o0."review_link", o0."owner_id", o0."reviewer_id", o0."status_id", o0."problem_id", o0."type_id", o0."inserted_at", o0."updated_at" FROM "orders" AS o0 []

[debug] QUERY OK source="users" db=1.3ms idle=1590.2ms

SELECT u0."id", u0."password_hash", u0."email", u0."inserted_at", u0."updated_at", u0."id" FROM "users" AS u0 WHERE (u0."id" = $1) [1]

[info] Sent 200 in 10ms

And here is my controller and context code:

def index(conn, _params) do
    orders = Orders.list_orders()
    render(conn, "index.html", orders: orders)
  end

def list_orders do
    Repo.all(from o in Order, preload: [:owner, :reviewer])
  end

Here is what my routes:

  pipeline :browser do
    plug :accepts, ["html"]
    plug :fetch_session
    plug :fetch_flash
    plug :protect_from_forgery
    plug :put_secure_browser_headers
  end

  pipeline :skip_csrf_protection do
    plug :accepts, ["html"]
    plug :fetch_session
    plug :fetch_flash
    plug :put_secure_browser_headers
  end

  pipeline :api do
    plug :accepts, ["json"]
  end

  pipeline :protected do
    plug Pow.Plug.RequireAuthenticated, error_handler: Pow.Phoenix.PlugErrorHandler
  end

  scope "/" do
    pipe_through :skip_csrf_protection

    pow_assent_authorization_post_callback_routes()
  end

  scope "/" do
    pipe_through :browser

    pow_routes()
    pow_assent_routes()
  end

  scope "/", ReviewsWeb do
    pipe_through :browser

    get "/", PageController, :index
  end

  scope "/", ReviewsWeb do
    pipe_through [:browser, :protected]

    resources "/orders", OrderController
  end

  # Other scopes may use custom stacks.
  # scope "/api", ReviewsWeb do
  #   pipe_through :api
  # end

  # Enables LiveDashboard only for development
  #
  # If you want to use the LiveDashboard in production, you should put
  # it behind authentication and allow only admins to access it.
  # If your application does not have an admins-only section yet,
  # you can use Plug.BasicAuth to set up some basic authentication
  # as long as you are also using SSL (which you should anyway).
  if Mix.env() in [:dev, :test] do
    import Phoenix.LiveDashboard.Router

    scope "/" do
      pipe_through :browser
      live_dashboard "/dashboard", metrics: ReviewsWeb.Telemetry
    end
  end

Versions:
PostgreSQL 11
Erlang 23
Elixir 1.10.3
Phoenix 1.5.3
Phoenix Ecto 4.1
Ecto SQL 3.4

Your responses gets sent within 20ms. Also ecto does only spend 1 to 6ms in the database for the 4 samples you have shown.

Also, please check if its really taking 5s to load the webpage or if just rendering is this slow. Use your browsers network inspection tools to verify.

2 Likes

What you can do to figure out what’s going on is to open dev tools in your browser, find some Network tab and see what it looks like and what is taking that time. As @NobbZ pointed out, it does look like your app loads pretty fast when it comes to executing the Phoenix request on the backend. But there may be some other problem.

For example, elixirforum.com loads like that for me, and you can see the individual requests in the Network tab plus on the right there are load times and the waterfall graph showing you at what time what loads. This way you can track down which request(s) really slow things down.

Here is the timing:


TTFB is the number of milliseconds it takes for a browser to receive the first byte of the response from your web server.

Interesting, it really takes that long. I assume you don’t have hundreds of thousands orders in database just yet either?

Seems like you have something wrong with your network, or something on the network between your phoenix app and the browser. The response times in the logs aren’t anywhere close to 5 seconds.

I’m not sure if it is the network. Look at the other request downloading the assets. They happen in a reasonable time.

All of them are static assets as far as I can tell.

@alexbezhan, could you perhaps show us the router and endpoint source code?

It’s 1 order record and 1 user record in db

Here is router code:

defmodule ReviewsWeb.Router do
  use ReviewsWeb, :router
  use Pow.Phoenix.Router
  use PowAssent.Phoenix.Router

  pipeline :browser do
    plug :accepts, ["html"]
    plug :fetch_session
    plug :fetch_flash
    plug :protect_from_forgery
    plug :put_secure_browser_headers
  end

  pipeline :skip_csrf_protection do
    plug :accepts, ["html"]
    plug :fetch_session
    plug :fetch_flash
    plug :put_secure_browser_headers
  end

  pipeline :api do
    plug :accepts, ["json"]
  end

  pipeline :protected do
    plug Pow.Plug.RequireAuthenticated, error_handler: Pow.Phoenix.PlugErrorHandler
  end

  scope "/" do
    pipe_through :skip_csrf_protection

    pow_assent_authorization_post_callback_routes()
  end

  scope "/" do
    pipe_through :browser

    pow_routes()
    pow_assent_routes()
  end

  scope "/", ReviewsWeb do
    pipe_through :browser

    get "/", PageController, :index
  end

  scope "/", ReviewsWeb do
    pipe_through [:browser, :protected]

    resources "/orders", OrderController do
      resources "/applications", OrderApplicationController, only: [:new, :create, :delete]
    end
  end

  # Other scopes may use custom stacks.
  # scope "/api", ReviewsWeb do
  #   pipe_through :api
  # end

  # Enables LiveDashboard only for development
  #
  # If you want to use the LiveDashboard in production, you should put
  # it behind authentication and allow only admins to access it.
  # If your application does not have an admins-only section yet,
  # you can use Plug.BasicAuth to set up some basic authentication
  # as long as you are also using SSL (which you should anyway).
  if Mix.env() in [:dev, :test] do
    import Phoenix.LiveDashboard.Router

    scope "/" do
      pipe_through :browser
      live_dashboard "/dashboard", metrics: ReviewsWeb.Telemetry
    end
  end
end

Here is endpoint code:

defmodule ReviewsWeb.Endpoint do
  use Phoenix.Endpoint, otp_app: :reviews

  # The session will be stored in the cookie and signed,
  # this means its contents can be read but not tampered with.
  # Set :encryption_salt if you would also like to encrypt it.
  @session_options [
    store: :cookie,
    key: "_reviews_key",
    signing_salt: "lKZ0alLT"
  ]

  socket "/socket", ReviewsWeb.UserSocket,
    websocket: true,
    longpoll: false

  socket "/live", Phoenix.LiveView.Socket, websocket: [connect_info: [session: @session_options]]

  # Serve at "/" the static files from "priv/static" directory.
  #
  # You should set gzip to true if you are running phx.digest
  # when deploying your static files in production.
  plug Plug.Static,
    at: "/",
    from: :reviews,
    gzip: false,
    only: ~w(css fonts images js favicon.ico robots.txt)

  # Code reloading can be explicitly enabled under the
  # :code_reloader configuration of your endpoint.
  if code_reloading? do
    socket "/phoenix/live_reload/socket", Phoenix.LiveReloader.Socket
    plug Phoenix.LiveReloader
    plug Phoenix.CodeReloader
    plug Phoenix.Ecto.CheckRepoStatus, otp_app: :reviews
  end

  plug Phoenix.LiveDashboard.RequestLogger,
    param_key: "request_logger",
    cookie_key: "request_logger"

  plug Plug.RequestId
  plug Plug.Telemetry, event_prefix: [:phoenix, :endpoint]

  plug Plug.Parsers,
    parsers: [:urlencoded, :multipart, :json],
    pass: ["*/*"],
    json_decoder: Phoenix.json_library()

  plug Plug.MethodOverride
  plug Plug.Head
  plug Plug.Session, @session_options
  plug Pow.Plug.Session, otp_app: :reviews
  plug ReviewsWeb.Router
end

I’m hitting “/orders” page

I just pushed the whole application here https://github.com/alexbezhan/slow-query-app

1 Like

I only clicked through related files randomly, the most prominent flaw I see is, that you are using Enum.count/1 within a for comprehensions body.

This can create problems similar to what you observe here, though to become a problem with this scale, you need huge and many datasets.

There is no way a loop could cause 5s latency.

Anyway, I just figured what the problem was. How? I runned a dummy node server http-server that is serving files and got the same 5s delay. This was strange, so I benchmarked the request with curl and saw that it’s actually namelookup taking 5s:

curltime http://localhost:4000
    time_namelookup:  5.091034s
       time_connect:  5.091551s
    time_appconnect:  0.000000s
   time_pretransfer:  5.091592s
      time_redirect:  0.000000s
 time_starttransfer:  5.099330s
                    ----------
         time_total:  5.099806s

After that I found an old IP pointing to localhost in my /etc/hosts that was no longer accessible. Deleted this and all is fine now. Thanks everyone for the help.

7 Likes