Strange performance (or monitoring) issue with phoenix behind nginx setup

Our main app is a Rails monolith, accompanied by Phoenix app for the websockets channels.
Both Rails and Phoenix are behind nginx, nginx has a separate server, rails app runs on 3 servers and phoenix on one server, all inside DigitalOcean datacenter.

This works fine for us and we plan to continue building new features using these blocks.

Now you have some context and here goes the problem itself:
I keep seeing upstream timed out (110: Connection timed out) while connecting to upstream error in nginx error.log (and 504 in access.log).
It is rather infrequent, say 0.01% or maybe even less (for quieter day like last Sunday it is actually 0.005% (3 requests out of ~60K), but I’m really annoyed by this error and want to get to the bottom of this.

Connection timed out means that nginx spent 60s waiting for the phoenix app to respond, this happens both with WSS connections, LP fallback and even API calls

This is the controller code:

  def stream_delay(conn, %{"time" => time}) do
    current = System.system_time(:millisecond)
    delay = ((current - String.to_integer(time)) / 1000) |> round

    json(conn, %{delay: delay})
  end

This is the pipeline:

  pipeline :public_api do
    if Application.get_env(:phoenix_app, :set_cors) do
      plug CORSPlug, origin: ["http://localhost:3000", "http://localhost:4000"]
    end

    plug :accepts, ["json"]
  end

I’m posting this to show that this code has no external dependencies.
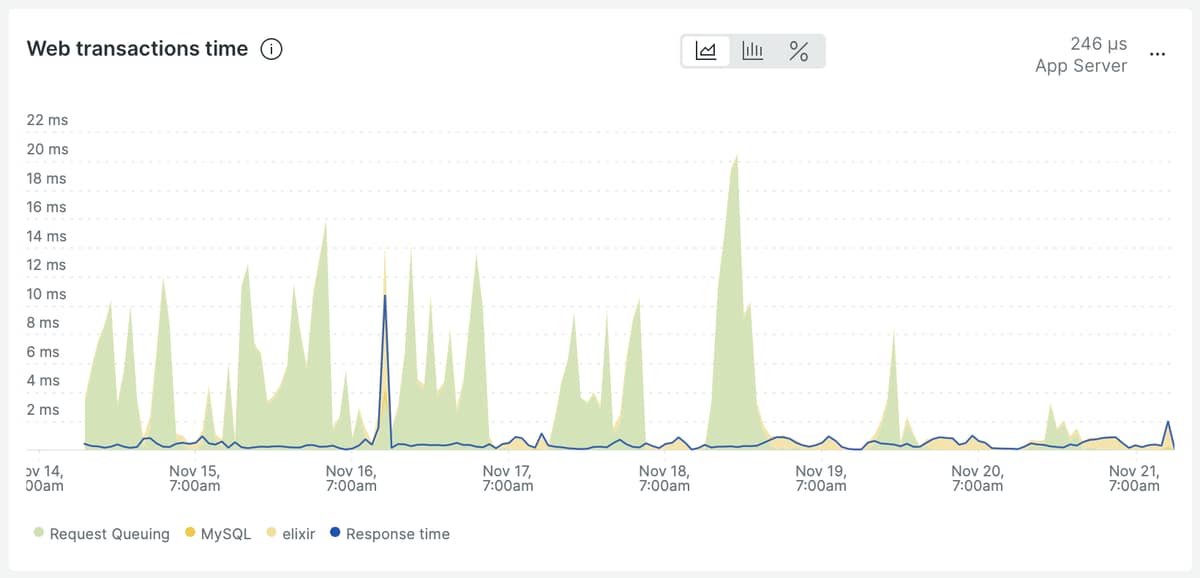
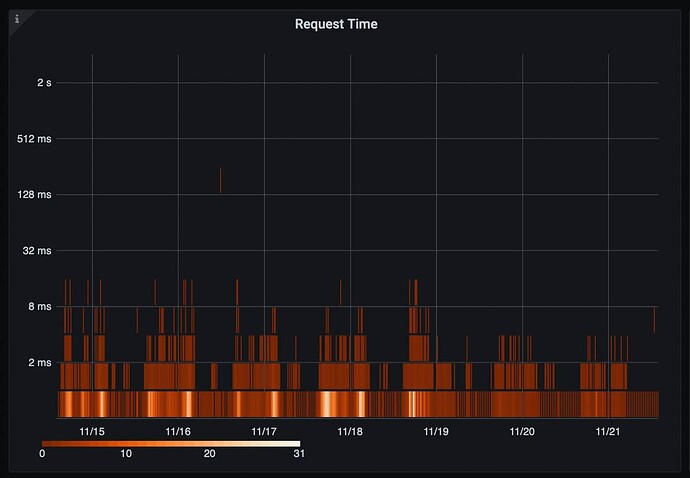
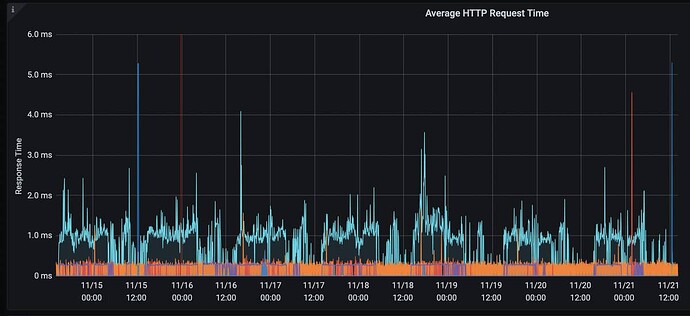
The response time according to 2 different monitoring tools (NewRelic and prom_ex phoenix exporter) is less than 1ms.
Also, according to node_exporter graphs, CPU (and this endpoint could be slow only due to CPU) is at ~5-10% (server has 8 cores / 32GB RAM)

And another thing – we use X-Request-Start header to observe the delay the requests spend in the queue before they can be processed by Phoenix, and I keep seeing some very strange numbers there, too: for the Rails app it is usually within 1-3ms (jumping up to 5ms-10ms sometimes), for the Phoenix app it can anywhere from 1ms to 30-50-100ms. That makes zero sense to me.

My initial nginx config was something like this:

location /phoenix/api { deny all; }

location /phoenix/ {
    proxy_set_header X-Real-IP $remote_addr;
    proxy_set_header X-Forwarded-For $proxy_add_x_forwarded_for;
    proxy_set_header Host $http_host;
    proxy_set_header X-Request-Start "t=${msec}";
    proxy_set_header Upgrade $http_upgrade;
    proxy_set_header Connection "Upgrade";
    proxy_redirect off;
    proxy_http_version 1.1;

    proxy_pass http://phoenix/;
}

I thought that these two guys

    proxy_set_header Upgrade $http_upgrade;
    proxy_set_header Connection "Upgrade";

could be an issue for the usual API calls, so I’ve separated it into 2 locations:

location /phoenix/socket/ {
    proxy_set_header X-Real-IP $remote_addr;
    proxy_set_header X-Forwarded-For $proxy_add_x_forwarded_for;
    proxy_set_header Host $http_host;
    proxy_set_header X-Request-Start "t=${msec}";
    proxy_set_header Upgrade $http_upgrade;
    proxy_set_header Connection "Upgrade";
    proxy_redirect off;
    proxy_http_version 1.1;

    proxy_pass http://phoenix/socket/;
    break;
}

location /phoenix/ {
    proxy_set_header X-Real-IP $remote_addr;
    proxy_set_header X-Forwarded-For $proxy_add_x_forwarded_for;
    proxy_set_header Host $http_host;
    proxy_set_header X-Request-Start "t=${msec}";
    proxy_redirect off;

    proxy_pass http://phoenix-api/;
}

Upstream looks like this:

upstream phoenix {
  server {{phoenix_app_address}}:4000;
}

upstream phoenix-api {
  server {{phoenix_app_address}}:4000;
  keepalive 5;
}

I added keepalive thinking that the only issue that could be at play here is a network subsystem and this can be improved by reducing the number socket connections made between nginx and phoenix, but I don’t see any improvements.

Speaking of sockets: both servers are nowhere near their open sockets limit, nginx sometimes has around 20K open sockets, phoenix server is usually 1/3 of that number, so it’s 6-7K.
Open file limit is 32K per nginx worker (we run 2 workers on 2 cores), for phoenix it is 65K.

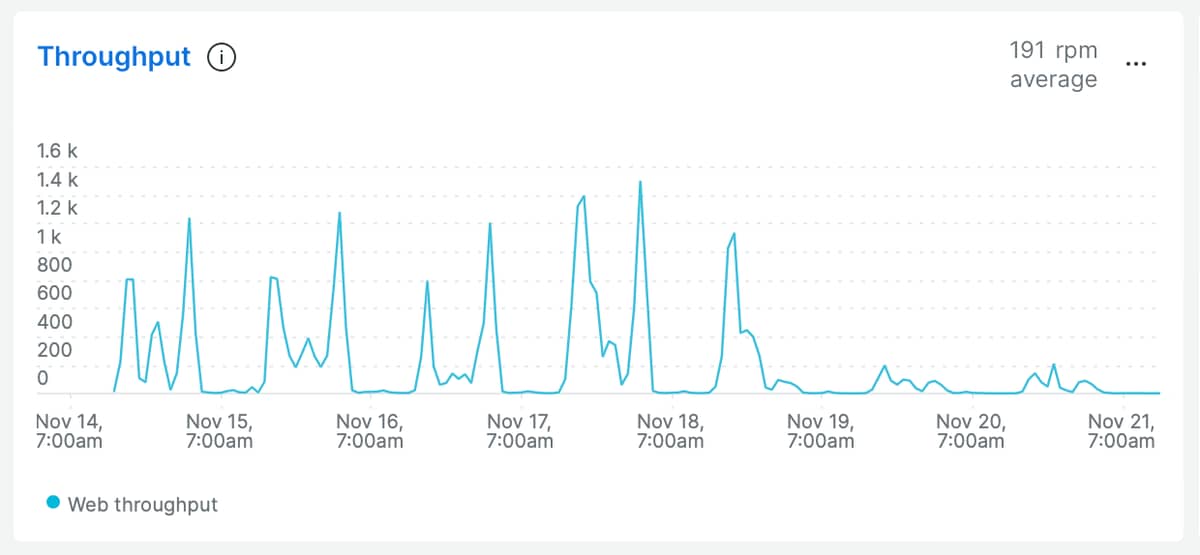
So my question is: how would you approach investigating this further? My experience with Rails tells me that queueing time and timeouts are caused by app being slow, but I see zero evidence that phoenix app is slow (both NewRelic and prom_ex tell me that 99% of requests are within 1-10ms range), so I’m trying to investigate the OS limits / perf, but again with zero success.

some graphs

PS
please, don’t suggest using phoenix without nginx, I’m aware about this option, I’m more interested in finding out what’s going on here rather than moving things around hoping it will help.

EDIT
After reading it again, I think that I can set proxy_connect_timeout and proxy_read_timeout to 1s (or 5s). This is way above what I would expect to see in production anyways, but it could give a clue if it is a very rare thing to happen, or there are many requests that spend say 3-5s waiting to connect to phoenix upstream.
Though if this number is reflected in the Queueing time in NR I think it would be much higher than 20-30ms if it was happening more often. But after all, I’m not even sure if these two (504 and queue time) are related or not.
3 Likes

currently if you don’t have upstream var logging you could add that and see it in better detail than in error log

"$upstream_addr" # upstream backend server for proxied requests
 "$upstream_connect_time" # upstream handshake time incl. TLS
 "$upstream_header_time" # time spent receiving upstream headers
"$upstream_response_time" # time spend receiving upstream body
"$upstream_response_length" # upstream response length
"$upstream_cache_status" # cache HIT/MISS where applicable

Also network is always dubious it might not be your app or nginx but the underlying network itself.

1 Like

Thanks for that hint, it really helped to clear at least one of my concerns: NewRelic Queueing time calculated from X-Request-Start header.

So right now, NR shows QT of 3-3.5ms, while the numbers in the log never go above 0.001 (1ms) for $upstream_connect_time, so on average it has to be below 1ms.

As for 504 error, since I’ve added new logs to the locations, it has been only one case and this is what I see:

nnn.nnn.nnn.nnn - - [23/Nov/2022:05:31:22 +0000] "GET /phoenix/socket/websocket?broadcast=-uuid HTTP/1.1" 101 76 "-" "UA"
nnn.nnn.nnn.nnn - - [23/Nov/2022:07:22:59 +0000] "GET /phoenix/socket/websocket?broadcast=-uuid HTTP/1.1" 101 144 "-" "UA"
nnn.nnn.nnn.nnn - - [23/Nov/2022:09:13:34 +0000] "GET /phoenix/socket/websocket?broadcast=-uuid HTTP/1.1" 504 2759 "-" "UA"
nnn.nnn.nnn.nnn - - [23/Nov/2022:09:29:59 +0000] "GET /phoenix/socket/websocket?broadcast=-uuid HTTP/1.1" 101 76 "-" "UA"
nnn.nnn.nnn.nnn - - [23/Nov/2022:10:13:14 +0000] "GET /phoenix/socket/websocket?broadcast=-uuid HTTP/1.1" 101 76 "-" "UA"


nnn.nnn.nnn.nnn - - [23/Nov/2022:05:31:22 +0000] "GET /phoenix/socket/websocket?broadcast=-uuid HTTP/1.1" 101 76 "-" "UA" rt=60.001 uct="0.001" uht="0.003" urt="60.002"
nnn.nnn.nnn.nnn - - [23/Nov/2022:07:22:59 +0000] "GET /phoenix/socket/websocket?broadcast=-uuid HTTP/1.1" 101 144 "-" "UA" rt=90.750 uct="0.000" uht="0.003" urt="90.749"
nnn.nnn.nnn.nnn - - [23/Nov/2022:09:29:59 +0000] "GET /phoenix/socket/websocket?broadcast=-uuid HTTP/1.1" 101 76 "-" "UA" rt=60.001 uct="0.000" uht="0.003" urt="60.000"
nnn.nnn.nnn.nnn - - [23/Nov/2022:10:13:14 +0000] "GET /phoenix/socket/websocket?broadcast=-uuid HTTP/1.1" 101 76 "-" "UA" rt=60.001 uct="0.000" uht="0.003" urt="60.000"

So clearly the request that failed ended up in access.log but not in access-phoenix-socket.log
I’m kinda curious why it is so, but that’s a topic for nginx forum, not elixir forum.

I will add more details when I have more errors in the logs.

Oh, and I forgot to mention, my nginx configuration had some problems, first of all

the API location had to have these 2 lines

    proxy_http_version 1.1;
    proxy_set_header Connection "";

without them adding keepalive to the upstream block doesn’t make sense because nginx adds Connection close header and bus forces phoenix o close the connection.

Finally, Phoenix should be reconfigured a bit, too, see this article The Erlangelist - Low latency in Phoenix, let me quote it:

Another thing I’ll change is the value of the max_keepalive Cowboy option. This number specifies the maximum number of requests that can be served on a single connection. The default value is 100, meaning that the test would have to open new connections frequently. Increasing this value to something large will allow the test to establish the connections only once and reuse them throughout the entire test. Here’s the relevant setting in prod.exs :

config :bench_phoenix, BenchPhoenix.Endpoint,
  http: [port: 4000,
    protocol_options: [max_keepalive: 5_000_000]
  ],
  url: [host: "example.com", port: 80],
  cache_static_manifest: "priv/static/manifest.json"

I haven’t changed Phoenix config because our endpoint receives much less traffic, and even reducing socket open/close frequency by 100 times is good enough.

Here is the last version of nginx config

location /phoenix/api/ { deny all; }

location /phoenix/socket/ {
    access_log /var/log/nginx/access.log combined;
    access_log /var/log/nginx/access-phoenix-socket.log upstream_time;

    proxy_set_header X-Real-IP $remote_addr;
    proxy_set_header X-Forwarded-For $proxy_add_x_forwarded_for;
    proxy_set_header Host $http_host;
    proxy_set_header X-Request-Start "t=${msec}";
    proxy_set_header Upgrade $http_upgrade;
    proxy_set_header Connection "Upgrade";
    proxy_redirect off;
    proxy_http_version 1.1;

    proxy_pass http://phoenix/socket/;
    break;
}

location /phoenix/ {
    access_log /var/log/nginx/access.log combined;
    access_log /var/log/nginx/access-phoenix-api.log upstream_time;

    proxy_set_header X-Real-IP $remote_addr;
    proxy_set_header X-Forwarded-For $proxy_add_x_forwarded_for;
    proxy_set_header Host $http_host;
    proxy_set_header X-Request-Start "t=${msec}";
    proxy_redirect off;
    proxy_http_version 1.1;
    proxy_set_header Connection "";

    proxy_pass http://phoenix-api/;
}

It has two issues:

  1. it doesn’t support liveView, you will have to copy location /phoenix/socket/ to location /phoenix/live/ (I just removed that part for brevity. Also, I don’t support blind copy/paste from Internet forums)
  2. location /phoenix/socket/ covers both WS and HTTP connections because it is basically the same URL (WS connection URL is /phoenix/socket/websocket?vsn=2.0.0, LP URL is /phoenix/socket/longpoll?... That makes me think if this causes any issues (passing Connection "Upgrade" header for usual REST API HTTP requests)
1 Like