System.cmd significantly slower when called from handle_event vs mount

We are seeing significantly higher latency when calling System.cmd from an event in a LiveView vs when the LiveView first loads. In order to demonstrate this cleanly (our app is fairly complex) I created an entirely new 1.7.2 project with mix phx.new ptest --no-ecto and added the following to lib/ptest_web/live/ls_live/index.ex.

defmodule PtestWeb.LsLive.Index do
  use PtestWeb, :live_view

  def mount(_params, _session, socket) do
    {:ok, assign(socket, :files, get_files())}
  end

  def render(assigns) do
    ~H"""
    <button phx-click="refresh">refresh</button>
    <div :for={file <- @files}><%= file %></div>
    """
  end

  def handle_event("refresh", _params, socket) do
    {:noreply, assign(socket, :files, get_files())}
  end

  defp get_files() do
    timer = Time.utc_now()

    {files, _} = System.cmd("ls", [])

    IO.puts("System.cmd took #{Time.diff(Time.utc_now(), timer, :milliseconds)} milliseconds")

    String.split(files, "\n")
  end
end

And, of course, the route: live "/ls", LsLive.Index, :index.

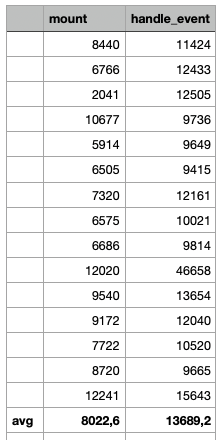
That System.cmd takes 2 milliseconds on average when called from mount on page load vs 15.6 milliseconds on average when called from handle_event when clicking the button. In our app we see about a 3x increase from ~11 millisecond when we call System.cmd from mount to ~33 when called from handle_event.

Any ideas why?

2 Likes

Not sure if that is the best way to measure how long something took. You can use :timer.tc(fun), which returns {microseconds, return_value}.

https://www.erlang.org/doc/man/timer.html#tc-1

The actual values from the timer don’t really matter, just the delta. But just to be thorough:

defmodule PtestWeb.LsLive.Index do
  use PtestWeb, :live_view

  def mount(_params, _session, socket) do
    {timer, files} = :timer.tc(fn -> get_files() end)
    IO.puts("get_files took #{timer} microseconds")

    {:ok, assign(socket, :files, files)}
  end

  def render(assigns) do
    ~H"""
    <button phx-click="refresh">refresh</button>
    <div :for={file <- @files}><%= file %></div>
    """
  end

  def handle_event("refresh", _params, socket) do
    {timer, files} = :timer.tc(fn -> get_files() end)
    IO.puts("get_files took #{timer} microseconds")

    {:noreply, assign(socket, :files, files)}
  end

  defp get_files() do
    {files, _} = System.cmd("ls", [])
    String.split(files, "\n")
  end
end

Results in

[debug] MOUNT PtestWeb.LsLive.Index
  Parameters: %{}
  Session: %{"_csrf_token" => "GsEAvH7i4wASwrbg3q4l0VA-"}
get_files took 2133 microseconds
[debug] Replied in 2ms
[debug] HANDLE EVENT "refresh" in PtestWeb.LsLive.Index
  Parameters: %{"value" => ""}
get_files took 17433 microseconds
[debug] Replied in 22ms

That is super weird! Can you show what get_files() does? How long does it take when you call it from iex? What happens if you call it twice in a row from iex?

get_files is right there on line 25. Everything is contained in the example.

In iex it’s pretty consistent.

iex(18)> {timer, files} = :timer.tc(fn -> Index.get_files() end)
{6035,
 ["README.md", "_build", "assets", "config", "deps", "lib", "mix.exs",
  "mix.lock", "priv", "test", ""]}
iex(19)> {timer, files} = :timer.tc(fn -> Index.get_files() end)
{6725,
 ["README.md", "_build", "assets", "config", "deps", "lib", "mix.exs",
  "mix.lock", "priv", "test", ""]}
iex(20)> {timer, files} = :timer.tc(fn -> Index.get_files() end)
{6930,
 ["README.md", "_build", "assets", "config", "deps", "lib", "mix.exs",
  "mix.lock", "priv", "test", ""]}
iex(21)> {timer, files} = :timer.tc(fn -> Index.get_files() end)
{6877,
 ["README.md", "_build", "assets", "config", "deps", "lib", "mix.exs",
  "mix.lock", "priv", "test", ""]}
iex(22)> {timer, files} = :timer.tc(fn -> Index.get_files() end)
{6424,
 ["README.md", "_build", "assets", "config", "deps", "lib", "mix.exs",
  "mix.lock", "priv", "test", ""]}
iex(23)> {timer, files} = :timer.tc(fn -> Index.get_files() end)
{7394,
 ["README.md", "_build", "assets", "config", "deps", "lib", "mix.exs",
  "mix.lock", "priv", "test", ""]}

Apologies, missed that! That is indeed very weird, I have no obvious answer for you. Is a valid workaround for your situation to use File.ls? This is much faster than shelling out.

How about “time ls”? Curious how much of the time is spend executing the command vs all the work to getting to a shell where the command can be executed.

1 Like

Unfortunately no because we aren’t listing files on the system, we are shelling out to a custom executable. :stuck_out_tongue: The file listing was just to demonstrate the issue. You can swap that ls for any other shell command and see the same issue. You can even see the same issue with File.ls, it’s just the numbers are much smaller because File.ls is, as you say, much faster. The issue is the same though:

[debug] MOUNT PtestWeb.LsLive.Index
  Parameters: %{}
  Session: %{"_csrf_token" => "GsEAvH7i4wASwrbg3q4l0VA-"}
get_files with File.ls! took 153 microseconds
[debug] Replied in 232µs
[debug] HANDLE EVENT "refresh" in PtestWeb.LsLive.Index
  Parameters: %{"value" => ""}
get_files with File.ls! took 2096 microseconds
[debug] Replied in 6ms

@ohnoimdead Interesting! Dumb question: If you Process.sleep(100) in your handle_event first and then do your File.ls does the time improve? I wonder if there is other file IO being triggered by the handle_event that is competing with yours.

Interesting thought but the time to execute the command is consistent—it’s something with the process.

[debug] MOUNT PtestWeb.LsLive.Index
  Parameters: %{}
  Session: %{"_csrf_token" => "GsEAvH7i4wASwrbg3q4l0VA-"}
        0.00 real         0.00 user         0.00 sys
get_files took 4233 microseconds
[debug] Replied in 4ms
[debug] HANDLE EVENT "refresh" in PtestWeb.LsLive.Index
  Parameters: %{"value" => ""}
        0.00 real         0.00 user         0.00 sys
get_files took 21385 microseconds
[debug] Replied in 27ms

That’s with

  def get_files() do
    {files, _} = System.cmd("time", ["ls"])
    String.split(files, "\n")
  end

Haha, that was actually the first thing I tried (although I used :timer.sleep). Great minds. Unfortunately any additional time added through a sleep is just added to the execution time. The delta time difference between mount and handle_event is the same in either case. I can paste a demo of this, but hopefully you can take my word for it.

EDIT

Also, just to rule out some sort of dev vs prod environment issue, I updated the example to display the execution time on the page then ran the app with MIX_ENV=prod and took a few samples. The difference is much less pronounced, but still consistently slower with handle_event vs mount (according to my super scientific sciencing):

image

Here’s the updated example for those playing along:

defmodule PtestWeb.LsLive.Index do
  use PtestWeb, :live_view

  def mount(_params, _session, socket) do
    {timer, files} = :timer.tc(fn -> get_files() end)

    socket = assign(socket, :timer, "get_files took #{timer} microseconds")
    {:ok, assign(socket, :files, files)}
  end

  def render(assigns) do
    ~H"""
    <button phx-click="refresh">refresh</button>
    <div :for={file <- @files}><%= file %></div>
    <div><%= @timer %></div>
    """
  end

  def handle_event("refresh", _params, socket) do
    {timer, files} = :timer.tc(fn -> get_files() end)

    socket = assign(socket, :timer, "get_files took #{timer} microseconds")
    {:noreply, assign(socket, :files, files)}
  end

  def get_files() do
    {files, _} = System.cmd("ls", [])
    String.split(files, "\n")
  end
end

Does handle_event/3 always trigger a re-render?
From Elixir School’s liveview tutorial:

Let’s build out our handle_event/3 function for the "github_deploy" event:

def handle_event("github_deploy", _value, socket) do
 # do the deploy process
 {:noreply, assign(socket, deploy_step: "Starting deploy...")}
end

Our function is responsible for two things. First, it will kick off the deploy process (coming soon). Then, it will update the value of the :deploy_step key in our socket. This will cause our template to re-render the portion of the page with <%= @deploy_step %>, so the user will see Status: Ready! change to Status: Starting deploy....

Does the mount call trigger a re-render?

Certainly the render pipeline is different between mount and handle_event, however, I’m not measuring render time. The timer is wrapping only the call to System.cmd. That’s why this is really a head scratcher. We are only looking at the time it takes to execute a shell command—nothing related to rendering.

EDIT

It did make me curious if it’s possible to reproduce the issue with a function that is computationally expensive just to see if the performance issue is more pervasive. I can’t reproduce that easily. Calculating the sqrt of 1…1_000_000 actually shows the opposite: slightly slower from mount than handle_event. So I have no idea. It makes no sense that System.cmd, System.shell, and File.ls are all significantly slower when called from handle_event. I even scoped out observer to see if anything stood out. I got nothing. I suppose I can file a bug on LiveView and maybe one of the core folks knows what’s up. :man_shrugging:

Have you tried to run System.cmd from a detached task? I have a feeling that liveview process might be processing a lot of messages in the background.

I’m not sure I follow. This is an empty example app with a single LiveView running on localhost. I’m quite certain you could phx.new a new project and drop the file above in and reproduce the issue yourself. Or do you mean you think LiveView or Phoenix is generating a lot of messages as part of the normal processing of handle_event that is impacting the performance?

Exactly, since the messages are always processed synchronously, that might be a bottleneck too.

This is a generalization of the question I raised. I assumed a difference in messages/processes between mount and handle_event was related to a difference in the rendering pipeline, which was probably not a valid assumption.

The only issue I have with that theory is that if it were true that other factors, which are normal to the execution stack of handle_event, cause performance issues, then handle_event should be generally slower then mount for most cases, but that doesn’t appear to be true. Or to try and put that more succinctly: why is handle_event slower than mount for System.cmd, but not for an arbitrary computationally intense function?

All I can say for sure is: “System.cmd and System.shell perform consistently 3-10x slower when called from handle_event than mount in dev, and ~.5-1x slower in prod.” And I’m pretty sure anyone can reproduce this themselves because I’ve reproduced it on two separate machines quite consistently with an empty project and systems under no extra load.

There are a lot of variables here in play, since System.cmd uses a port to start and execute a native binary there are a lot of things that can go wrong here, I just proposed a possible bottleneck, even though I think that zombie processes are the most probable culprit here.

Generally speaking I would avoid using System.cmd and instead opt for a long-running native binary that will communicate over the port with the VM, the main issue is that you cannot ensure that there will be no process/memory leaks on your server, making it very unstable.

1 Like

Gotcha. Yeah, it seems like this can’t be the case though for the reason I describe in response to @D4no0 above: if there is other processing causing slow performance for handle_event vs mount, then that slowness should be consistently observable in most cases. However, that does not appear to be true. In fact, handle_event seems to be generally faster EXCEPT in the case of System.cmd or System.shell (or File.ls). There may be other cases as well, I’m not sure. It’s very odd.