Because this was a team effort, I’m going to try and quickly summarize below while also giving huge thanks to the help from everyone in this thread. You are all wonderful people. The Elixir community is a blessing.
The issue, while not completely root caused, appears to be related to Apple silicone. If you are seeing a performance hit related to one of System.cmd, System.shell, Port.open, File.ls or likely any Elixir function which ultimately shells out to the underlying OS, and you are on an M1, that’s likely the reason and you should check perf against a non-Apple chipset machine to see if the issue persists.
I agree that it would be nice to get an actual root cause. It might not be M1 chip related directly, it might be caused by some other factor that only happens on M1 machines. I poked around a bit last night to see if it was maybe Rosetta, which doesn’t appear to be the case. It’s actually fairly easy to see what OS processes are going through Rosetta, and beam.smp isn’t one of them, nor did I see anything else that looked suspicious. I’m wondering now if maybe it’s some sort of security check process happening: i.e. some sort of extra “are you allowed to run a command” check that is happening on newer mac systems which happens earlier in the cycle with mount, but in the case of handle_event is called right at the moment of System.cmd. It’s all a bit of wild guessing at this point and I’m definitely out of my league here.
I did turn off Spotlight indexing of my “src” folder, just to rule that out as per Jose’s post above. No dice.
If anyone has any good ideas to pursue, I’m totally happy to test them out as I have a solid repro on two machines, and a solid non-repro on a similar non-m1 machine. And we have at least one other person that can repro as well. It would feel great to pin this down exactly, but I also need to make a product and this is no longer critical path (thank goodness).
macOS does security checks of programs that are started. Perhaps there is some of that going on but I don’t know why it would work differently in mount and events.
While there might be some version that this does, or does not, repro on, I’m not sure there’s water at the bottom of that well.
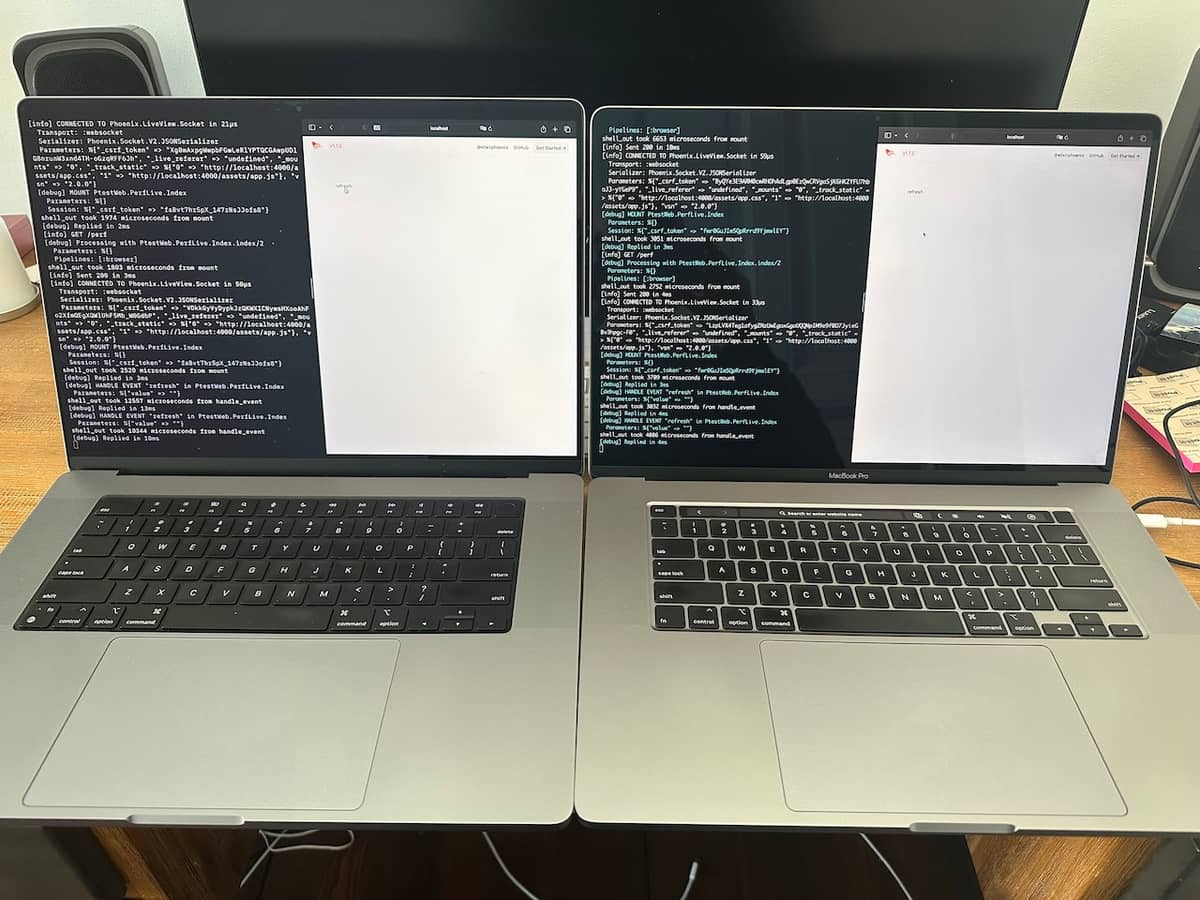
I present, for this thread, a tale of two laptops in photographic form. Who doesn’t like a picture book?
Chapter 1
Wherein two Apple laptops running nearly identical OSs, one M1 Max, one Intel (the Intel Macs are getting slower OS updates these days, which is why there’s a point difference) can be seen.
Wherein the M1 Mac has fast mount (2 & 3 ms), slow handle_event (13 & 10 ms) and the Intel Mac has fast mount (3 & 3 ms), fast handle_event (3 & 4 ms).
I would show my other M1 repro, but that machine is currently with my husband. But trust me when I say, the results are identical between the two M1s (also per @LostKobrakai). I could also show my Linux/Ubuntu box but again, no repro there (as per other posts in this thread).
And just to be clear: I’m in no way saying there isn’t something else going on beyond architecture. It could be anything at this point. There’s very little data and no root cause. But I am saying that focusing on Elixir/Erlang/OTP version differences might not be useful, given the data we do have.
There’s clearly SOMETHING going on. I spent like 2 hours yesterday trying to get the Console app to give me meaningful data to correlate browser request → beam.smp response and boy howdy is log surfing a pain in the ass on Macs. For those not on this platform: Apple has it’s own log format called ASL which is only parsable by their tooling.
I was able to reproduce your result on my Apple M2. However, by taking repeated measurements of the System.cmd at each test case instead a single command showed that the time approached a consistently low value. I think we may be seeing some scheduling overhead of a BEAM scheduler thread within macOS. I wrote the following test to help demonstrate. You can execute it with elixir system_cmd_idle_test.exs
21:30:56.947 [info] Sleeping 2000 msec

21:30:58.967 [info] before_server - First sample: 15140 usec

21:30:59.216 [info] before_server - Next 100 samples (median): 1830 usec

21:30:59.216 [info] Sleeping 2000 msec

21:31:01.225 [info] Accepting connections on port 4040. Exec `curl localhost:4040` now.

21:31:03.306 [info] http - First sample: 4970 usec

21:31:03.487 [info] http - Next 100 samples (median): 1660 usec

21:31:03.487 [info] Sleeping 2000 msec

21:31:05.499 [info] after_server - First sample: 10904 usec

21:31:05.723 [info] after_server - Next 100 samples (median): 1776 usec
Basically, I’m speculating that there is something about macOS that is considering a BEAM scheduler thread “idle” at a given moment, and at these moments, a System.cmd has additional overhead somewhere. It’s hard for me to pinpoint where, but this overhead seems to disappear when making a large number of System.cmd calls (100 in my test).
Yeah, nice one! So this is interesting: running your test I’m able to repro on both the Intel Mac and the M1 Max with fairly similar results. There might be multiple things going on here. I think the idea that there’s a cold-startup cost that’s paid every time in some contexts while other times it’s paid once up front makes sense.
M1 Max
09:51:08.839 [info] Sleeping 2000 msec
09:51:10.855 [info] before_server - First sample: 13064 usec
09:51:10.980 [info] before_server - Next 100 samples (median): 1079 usec
09:51:10.980 [info] Sleeping 2000 msec
09:51:12.987 [info] Accepting connections on port 4040. Exec `curl localhost:4040` now.
09:51:34.023 [info] http - First sample: 3018 usec
09:51:34.136 [info] http - Next 100 samples (median): 1077 usec
09:51:34.136 [info] Sleeping 2000 msec
09:51:36.144 [info] after_server - First sample: 6768 usec
09:51:36.272 [info] after_server - Next 100 samples (median): 1075 usec
Intel
09:56:38.248 [info] Sleeping 2000 msec
09:56:40.265 [info] before_server - First sample: 10484 usec
09:56:40.463 [info] before_server - Next 100 samples (median): 1807 usec
09:56:40.463 [info] Sleeping 2000 msec
09:56:42.469 [info] Accepting connections on port 4040. Exec `curl localhost:4040` now.
09:57:00.740 [info] http - First sample: 2536 usec
09:57:00.921 [info] http - Next 100 samples (median): 1763 usec
09:57:00.922 [info] Sleeping 2000 msec
09:57:02.927 [info] after_server - First sample: 4891 usec
09:57:03.124 [info] after_server - Next 100 samples (median): 1777 usec
Apple M1 and up has 2 different process cores, hi-perf ones and hi-efficiency ones. The extra latency observed here could be the process bumping from a slow core to a fast core.
Intel alder lake and up also has something similar. Those asymmetric cores are nasty for OS scheduler to optimize for. MacOS is probably doing something overly aggressive here and trip up when BEAM is forking external processes.
Because I now need to have some visibility into System.cmd execution times in production, I’ve added a custom telemetry event, which was super easy thanks to Phoenix and Telemetry. I basically just extracted out the execution of our binary and wrapped it using :telemetry.span/3. The first part is me jamming refresh on the LiveView which queries the executable during mount to show an initial result, then the second part is me jamming a button which re-queries via handle_event. No change from anything already discussed above, but kind of interesting to see a graph. We needed telemetry here anyway, so it was good to add regardless.
I’m expecting we will see consistently low execution times in prod, but just in case…
My backup plan is to wrap our binary in a tiny micro-service written in Go or Rust with a socket listener or http endpoint, but I really don’t want to eat that extra complexity unless we absolutely have to. So… fingers crossed this is just some kind of weird Mac thing!
What do you mean by “fastest way”? Fast in execution time of the core executable? Fast in the time it takes to deliver a UI based on output from the executable? Fast in implementation time and go-to-market?
Regardless of the general “you are probably doing it wrong” advice in this thread, the fact remains that Elixir provides a System.cmd (as does just about every other language specifically to make it possible to do what we are already doing on other platforms) and it performs pretty badly in this one context. If the answer is: rewrite your executable and retool every other property that currently uses that executable to work around this performance issue, then my only response is: that doesn’t work for us.
Sorry if I sounded condescending. My suggestions would be:
use a pure Elixir solution and avoid the process creation cost
If the thing depends on non-elixir libraries, try to wrap it in a NIF.
If NIF wrapping is impossible or hard, try to make a long running stand-alone process and communicate with it though a port.
If you are only given an opaque binary then tough luck. The System.cmd code is very simple; so I don’t think the problem that you are experiencing is unique to Elixir.
Yeah this is one of the problems when you have a technology that runs on multiple platforms, with different architectures, implemented with different standards. Pointing the finger to elixir here is not correct in this case, as the problem you are facing comes from running on bleeding edge hardware that was not correctly optimized.