Telemetry.Poller - periodically collect VM and custom measurements and publish them as Telemetry events (v0.2.0 is out!)

Hi there :wave:

We’ve just released version 0.2.0 of Telemetry.Poller. Telemetry.Poller is a simple process periodically invoking functions provided to it, which in turn should perform a measurement and dispatch a Telemetry event with collected value.

Telemetry.Poller can invoke any function, but it also provides a few predefined measurements related to the Erlang VM - currently memory and run queue lengths.

With the new version, a default Poller process is started under the telemetry_poller application with a default set of VM measurements. This means that by dropping this line in your deps

  {:telemetry_poller, "~> 0.2"}

you expose handful of useful metrics via Telemetry events!

You can read more about it in the docs. If you have any suggestions for improvements or other VM measurements, please submit an issue on GitHub. And obviously feel free to ask any questions in the thread below - your feedback is more than welcome! :heart:

12 Likes

Hello @arkgil, I’ve come across your work on the Telemetry “ecosystem” from this tweet:

https://twitter.com/_arkgil/status/1084454450415190016

I’ve been playing a little bit with :telemetry, Telemetry.Poller and Telemetry.Metrics (which has been released on hex.pm in the meantime).

I really like what I’ve see so far: a simple abstraction for instrumentating, aggregating and dispatching metrics :raised_hands:

I’m developing a Git platform alà GitHub and currently I’m diving into error and metric tracking.

My first attempt was to rely on the Influx ecosystem (InfluxDB, Chronograf, Kapacitator) with the help of the Exometer library. Recently, I tried different services such as New Relic and AppSignal.

Still, I would rather roll-out my own metric tracking system than having to rely on 3rd-party services.


Ecto 3.0 already uses :telemetry. I’m also confident that Phoenix will integrate :telemetry for HTTP/Websocket instrumentation in a near future. Other libraries such as Absinthe might also do so as well soon.

For me, the really nice thing about Telemetry is that I don’t have to clutter existing code with a lot of metric related stuff (aggregation, third-party service integration). I can have a totally separated application containing metric related code and voilà.

Right now, it feels like the ecosystem is in it first steps and I would love to see more documentation (hexdocs.pm, blog posts, code examples, etc.).

In your tweet, you talk about a Phoenix fork. Do you have to fork some Phoenix internals or only provide your own Telemetry instrumenter?

I’ve been also using your Telemetry StatsD implementation to try things out and would really appreciate if you could provide a basic Phoenix/Ecto integration example.

Also, most metric tracking services I’ve used so far use something like a “transaction” in order to group different metrics together.

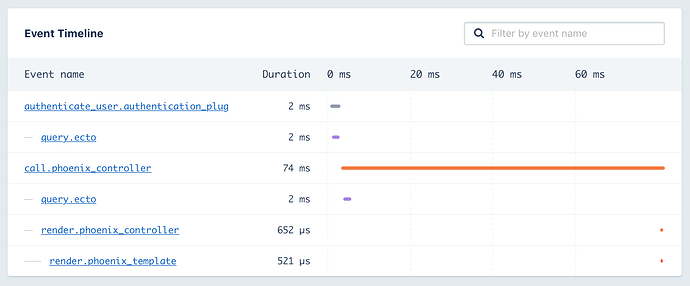
For example, AppSignal can give me an event timeline as follow:

It also offers the possibility to attach metadata (such as the authenticated user for example) to each transaction.

Could something like a transaction be implemented in a similar manner than Telemetry.Metrics? Let’s say we want to provide an event timeline like in my screenshot below. How can I group/categorize :telemetry events in order to know that the incoming Ecto query event is part of the Phoenix controller block?

Thank you in advance, and kudos for the great work so far. I’m really impressed :heart_eyes:

3 Likes

Thank you for your kind words! :slightly_smiling_face:

I’m also confident that Phoenix will integrate :telemetry for HTTP/Websocket instrumentation in a near future.

That’s the plan! You can check out my fork here GitHub - arkgil/phoenix at telemetry. I try to keep it up-to-date with the most recent Telemetry version, although there are barely any changes comparing to stock Phoenix: Comparing master..telemetry · arkgil/phoenix · GitHub (I haven’t instrumented the channels, though). Also note that it’s not up-to-date with Phoenix master, basically I use it for experimenting with new Telemetry versions :smile:

Also, most metric tracking services I’ve used so far use something like a “transaction” in order to group different metrics together.

This kind of tracing is something I keep in the back of my mind. As you said, a lot of APM solutions offer such features, and there are even a couple standards for it, like OpenTracing and OpenCensus. For this to work, we would need to somehow correlate events and decide when to open and close a span (one “level” in the trace). This is not hard to achieve in the context of a single process (e.g. see tracelog) but becomes more tricky with multiple processes, since you need to pass a value which correlates the events between them. Still, having it even for a single process would be awesome, and would work well for a number of Phoenix+Ecto apps. As with metrics, I don’t think it belongs in the Telemetry library itself, but it would be a great addition to the ecosystem!

3 Likes

What you have shown on this image isn’t metrics, what you have shown there is called tracing and while it has some similarities to metrics it is completely different beast. In general there are 3 pillars of the observability:

  • Metrics
  • Logs
  • Traces

Grafana have written nice piece of article to state difference between metrics and logs. The difference between traces and logs is that traces are connected, not only within single instance/request, but though whole life of the request. For example in (distributed) tracing you can check how long the request spent in LB, router, controller, Ecto queue, etc. So while it all seems connected each of the pieces has it’s own place and use case and you should know the difference.

Tracing libraries for Erlang are still in the flux, but I have prepared list of already available tools, feel free to check this out.

3 Likes

Telemetry.Poller 0.3.0 has been released! :tada: The new version uses Telemetry 0.4.0, which means that it can emit multiple measurements in a single event. For example, all the memory measurements are carried in a signle event now.

Check out the docs for the new version, and the changelog for more info on the introduced changes :slightly_smiling_face:

2 Likes