
mikunn
Trying to figure out why 2.3 MB JSON binary allocates 35 MB of heap
I’m trying to debug large memory spikes in our production environment. I tried to see if I could create something similar with as minimal application as I could. I’m using newest Erlang and Elixir, but saw the same behaviour with OTP 21 and Elixir 1.10.
So I created a new app with mix new, installed Jason and opened up iex.
I wanted to create a fairly large JSON, so I decided to quickly create a map that I would use as a values for a bigger map. So here’s the value
iex(1)> value = %{"foo" => ["a", "b", "c"], "bar" => [1, 2, 3]}
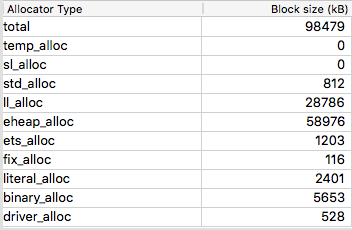
I wanted to see what the memory allocation looks like before I create the bigger map, so I opened up Observer and saw something like this in Memory allocators tab

Total, eheap_alloc and binary_alloc are the most interesting ones.
Then I created the bigger map
iex(3)> map = 1..50_000 |> Enum.reduce(%{}, fn idx, acc -> key = "key#{idx}"; Map.put(acc, key, value) end)
It’s a bit hard to read, but it basically creates a map with 50 000 keys where the value is always taken from the value variable created before.
So now the memory allocations look as follows

So eheap_alloc went up ~13 MB and binary alloc about 2 MB. This kind of makes sense as :erts_debug.flat_size(map) * 8 (64-bit system) would give about 23 MB and some of that map is probably shared in memory.
What I don’t understand, however, is the memory allocation of the next one
iex(4)> json = Jason.encode!(map)
eheap_alloc goes up almost 35 MB while binary_alloc goes up about 2.4 megs, which is pretty much the size of the binary
iex(4)> byte_size(json)
2338895
I’ve learned that binaries larger than 64 kB are stored outside of the process in a special binary heap, which I would assume is represented by the binary_alloc as it nicely matches to the size of the binary.
But where does that 35 MB of (process?) heap allocation come from?
I also tried making the json an iolist with Jason.encode_to_iodata! and it allocates even more heap.
Thanks for any insights!
Marked As Solved

Also Liked
mikunn
Thanks everyone for the replies! Swapping Jason with jiffy has worked well so far.
Our original problem of slow and very memory inefficient Phoenix view rendering was also largely due to the legacy usage of Timex.to_datetime(some_naive_datetime, "Etc/UTC") in a view. It turned out to be like 15 times slower and consume 30 times more memory compared to DateTime.from_naive!(some_naive_datetime, "Etc/UTC").

Eiji
Here you go:
Environment
asdf current
elixir          ref:master      /home/…/.tool-versions
erlang          23.2.3          /home/…/.tool-versions
…
dependencies
Resolving Hex dependencies...
Dependency resolution completed:
New:
  benchee 1.0.1
  deep_merge 1.0.0
  jason 1.2.2
* Getting benchee (Hex package)
* Getting jason (Hex package)
* Getting deep_merge (Hex package)
==> deep_merge
Compiling 2 files (.ex)
Generated deep_merge app
==> benchee
Compiling 39 files (.ex)
Generated benchee app
==> jason
Compiling 8 files (.ex)
Generated jason app
operating system
$ uname -a
Linux archlinux 5.10.9-arch1-1 #1 SMP PREEMPT Tue, 19 Jan 2021 22:06:06 +0000 x86_64 GNU/Linux

$ cat /proc/version
Linux version 5.10.9-arch1-1 (linux@archlinux) (gcc (GCC) 10.2.0, GNU ld (GNU Binutils) 2.35.1) #1 SMP PREEMPT Tue, 19 Jan 2021 22:06:06 +0000

$ cat /etc/*release
LSB_VERSION=1.4
DISTRIB_ID=Arch
DISTRIB_RELEASE=rolling
DISTRIB_DESCRIPTION="Arch Linux"
NAME="Arch Linux"
PRETTY_NAME="Arch Linux"
ID=arch
BUILD_ID=rolling
ANSI_COLOR="38;2;23;147;209"
HOME_URL="https://www.archlinux.org/"
DOCUMENTATION_URL="https://wiki.archlinux.org/"
SUPPORT_URL="https://bbs.archlinux.org/"
BUG_REPORT_URL="https://bugs.archlinux.org/"
LOGO=archlinux
Benchee
without jason
example.exs
Mix.install([:benchee])
value = %{"foo" => ["a", "b", "c"], "bar" => [1, 2, 3]}

Benchee.run(
  %{
    "map" => fn -> 1..50_000 |> Enum.reduce(%{}, fn idx, acc -> Map.put(acc, "key#{idx}", value) end) end
  },
  time: 10,
  memory_time: 2
)
output
Not all of your protocols have been consolidated. In order to achieve the
best possible accuracy for benchmarks, please ensure protocol
consolidation is enabled in your benchmarking environment.

Operating System: Linux
CPU Information: Intel(R) Core(TM) i7-3630QM CPU @ 2.40GHz
Number of Available Cores: 8
Available memory: 15.52 GB
Elixir 1.12.0-dev
Erlang 23.2.3

Benchmark suite executing with the following configuration:
warmup: 2 s
time: 10 s
memory time: 2 s
parallel: 1
inputs: none specified
Estimated total run time: 14 s

Benchmarking map...

Name           ips        average  deviation         median         99th %
map          17.77       56.29 ms    ±88.83%       38.89 ms      311.39 ms

Memory usage statistics:

Name    Memory usage
map         25.17 MB

**All measurements for memory usage were the same**
with jason
example.exs
Mix.install([:benchee, :jason])
value = %{"foo" => ["a", "b", "c"], "bar" => [1, 2, 3]}

Benchee.run(
  %{
    "map" => fn -> 1..50_000 |> Enum.reduce(%{}, fn idx, acc -> Map.put(acc, "key#{idx}", value) end) |> Jason.encode!() end
  },
  time: 10,
  memory_time: 2
)
output
Not all of your protocols have been consolidated. In order to achieve the
best possible accuracy for benchmarks, please ensure protocol
consolidation is enabled in your benchmarking environment.

Operating System: Linux
CPU Information: Intel(R) Core(TM) i7-3630QM CPU @ 2.40GHz
Number of Available Cores: 8
Available memory: 15.52 GB
Elixir 1.12.0-dev
Erlang 23.2.3

Benchmark suite executing with the following configuration:
warmup: 2 s
time: 10 s
memory time: 2 s
parallel: 1
inputs: none specified
Estimated total run time: 14 s

Benchmarking map...

Name           ips        average  deviation         median         99th %
map           4.66      214.74 ms    ±44.25%      181.33 ms      567.80 ms

Memory usage statistics:

Name    Memory usage
map         73.19 MB

**All measurements for memory usage were the same**

mindreader
I have considered recently using a rust json encoder / decoder to make the operation as fast and memory efficient as possible. It is something our projects do so often and the json can get very large. It makes sense to do it as fast and efficiently as possible, particularly since it is a very well defined operation.
Popular in Questions


Other popular topics


Latest on Elixir Forum
Sponsor Spotlight

We build reliable cloud platforms for business-critical systems.
Categories:
Sub Categories:
Forums
Popular Tags
- #ecto
- #liveview
- #troubleshooting
- #learning-elixir
- #deployment
- #library
- #erlang
- #testing
- #genserver
- #mix
- #absinthe
- #remote-other
- #otp
- #plug
- #how-to-question
- #macros
- #postgres
- #channels
- #elixirconf
- #exunit
- #discussion
- #code-sync
- #javascript
- #podcasts
- #onsite
- #dialyzer
- #docker
- #authentication
- #umbrella
- #full-time-contract
- #podcasts-by-brainlid
- #ecto-query
- #elixir-ls
- #phoenix_html
- #iex
- #blog-post
- #graphql
- #genstage
- #ai
- #websockets
- #supervisor
- #advent-of-code
- #elixirconf-us
- #distillery
- #processes
- #forms
- #api
- #metaprogramming
- #security
- #performance
Our Sponsors

Build Elixir applications with speed and confidence.

Supporting innovation across the BEAM ecosystem.
We build reliable cloud platforms for business-critical systems.

Catch errors, track performance, monitor hosts and more.

Error tracking for Elixir devs who love to ship. Start your free account.

Develop your skills with books, videos, and courses.

Producing high quality Elixir screencasts since 2017.

The deployment platform built for Elixir: PaaS ease, VPS control.

The team behind Membrane, Popcorn, LiveDebugger. Available for hire.

Courses that'll move you from confusion to "Aha, now I get it!"