Appsignal will only show you what’s happening on the request itself. If things are getting delayed this likely means that the node is blocked by something (or multiple things) in the meantime.
I’ve isolated it to something within my endpoint because the very first plug in my router emits a log which is 20 odd seconds after the Plug.Logger log.
You’re still under the assumption that the code of the slow request is to blame, which I’d challenge. I would much rather expect something in your system acting up and slowing down web requests as a side effect.
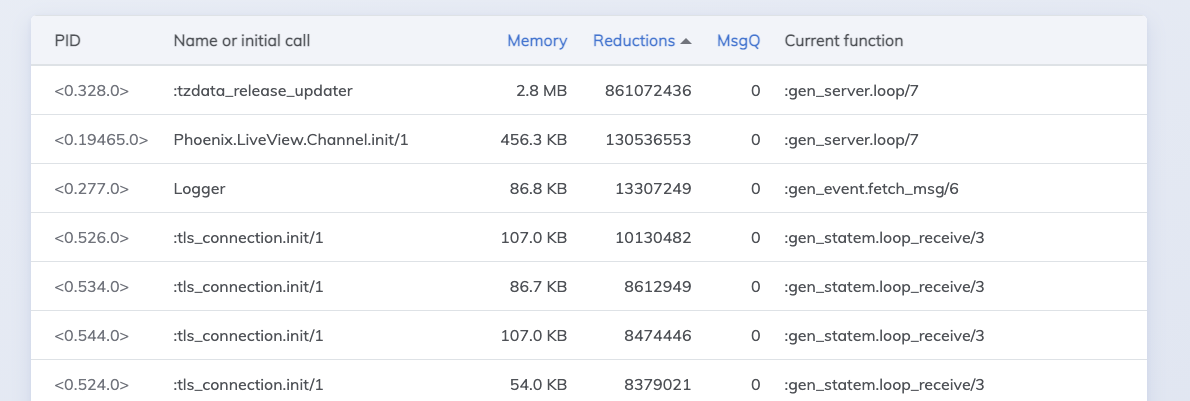
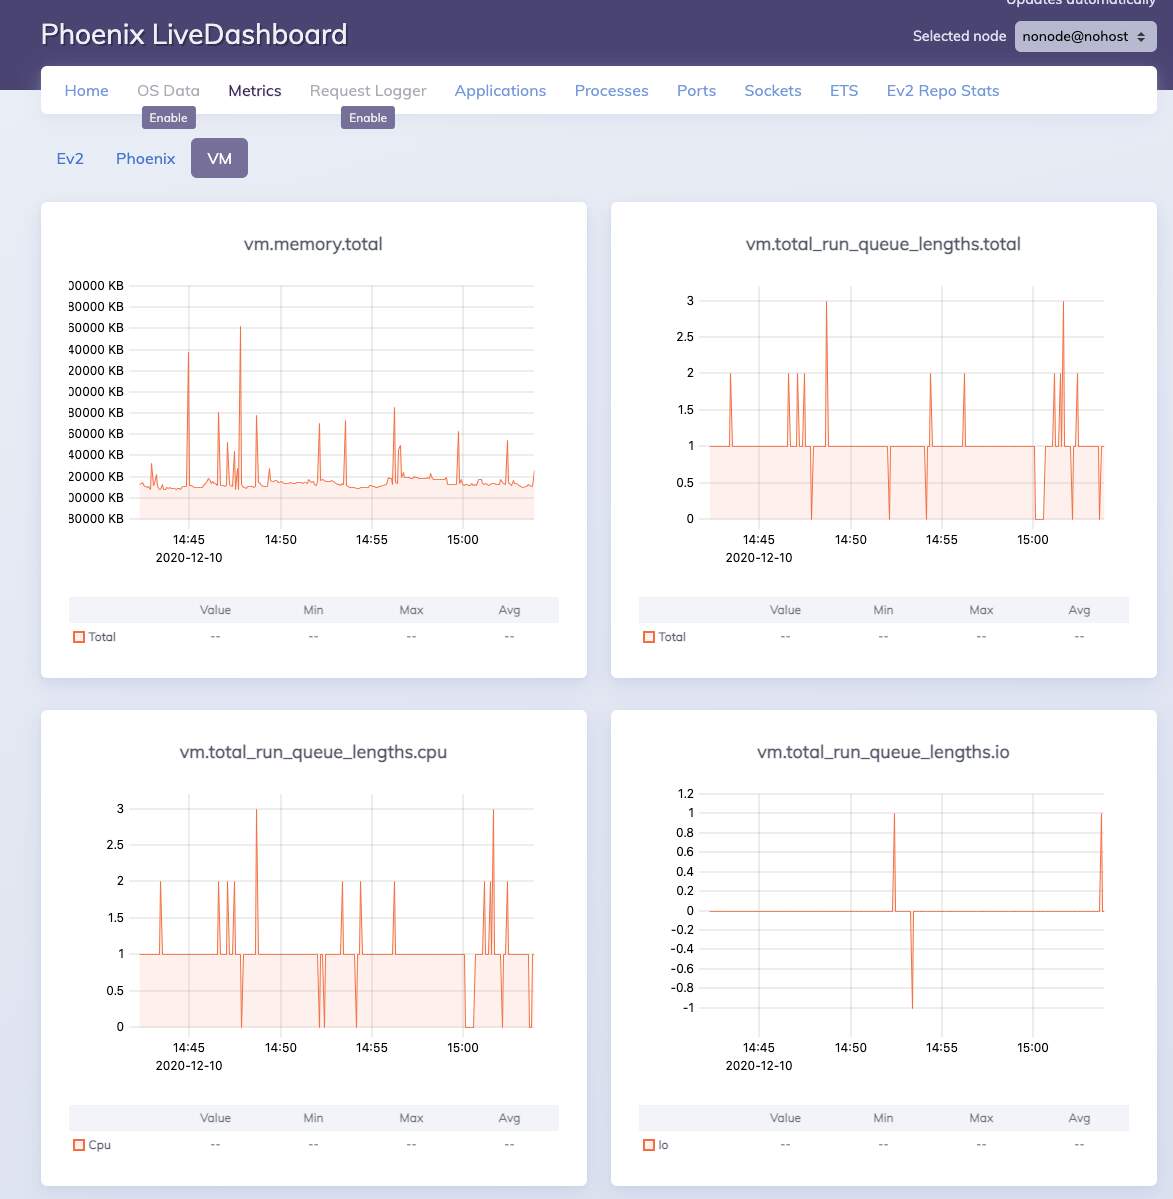
If you have the live dashboard enabled I’d monitor CPU usage in those instances. If the webrequests are indeed starved then it should be continuously very high cpu usage. Granted the dashboard might be affected as well if it’s indeed a system wide problem. Another thing you can do is look at the process list and look out for processes with very high reduction counts / quickly growing reduction count.
We’re seeing the same thing, or at least something similar.
We’ll return thousands of a certain POST request daily in 200-500ms, and then one will take 30s.
There are others that take longer (1-2s), but those seem to correspond with payload size whereas the 30s requests do not.
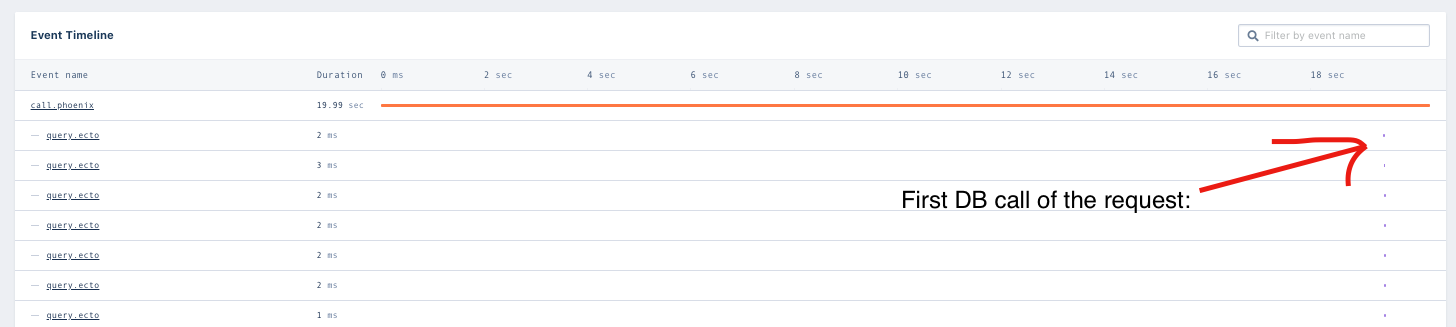
We’ve instrumented all of our plug calls for AppSignal, and it’s consistently happening at Plug.Parsers.
This is not the first plug in our endpoint.
Our incoming payloads contain a base64 image string. We wondered if there may be an issue with parsing it (w/ jason), but again, most make it through just fine (including some that are much larger than those in the the 30s requests). Just mentioning this in case our requests have this in common.
We’re also on Heroku. Metrics don’t seem to indicate any issues with memory or dyno load before or after those long requests. And when the dyno survives the long response, it goes on to serve more of the same type of request (and others) right away with no trouble.
We’re also experiencing sporadic slow requests (1-2s, sometimes up to 30s) affecting a POST endpoint with JSON body. Instrumenting the request pipeline via Appsignal points to a slowdown at Plug.Parsers, incurring a long waiting time till the request is properly handled.
The payload is invariably small (<1KB), containing one field holding one long base45 encoded string (600 bytes) and some small object. Our json_library is Jason.
This endpoint is called 500 times per minute at peak times, exhibiting minimal variance and short response times (<100ms) except for these outliers.
Could it be the same issue?
Our clients usually access this endpoint via mobile network, which might explain occasional slowdowns - but up to 30 seconds for a small-ish JSON payload?
Our endpoint (sans Plug.Parsers instrumentation):
defmodule Front.Endpoint do
  use Phoenix.Endpoint, otp_app: :front
  use Appsignal.Phoenix

  alias Front.Config

  plug(Front.Plugs.Web.CheckHealth)

  plug(Plug.Static,
    at: "/",
    from: :front,
    gzip: false,
    cache_control_for_etags: "public, max-age=31536000",
    only: ~w(css fonts images js docs favicon.ico robots.txt)
  )

  if code_reloading? do
    plug(Phoenix.CodeReloader)
  end

  plug(Plug.RequestId)
  plug(Plug.Parsers, Config.parser_options())
  plug(Plug.MethodOverride)
  plug(Plug.Head)
  plug(Plug.Session, Config.session_options(Mix.env()))
  plug(Corsica, Config.corsica_options(Mix.env()))
  plug(Front.Router)
end
We are pretty sure that our problem was caused by the logger going into sync mode.
I wasn’t responsible for the fix so don’t have too much understanding of the problem, but essentially we were using a 3rd party logging backend which sent logs over http. The hypothesis was that the logging API had occasional problems connecting and thus the logger would not be able to process application logs quickly enough, which supposedly causes it to move into sync mode.
Again I have limited understanding of the above so please verify the logger behaviour for yourself. I just thought I’d try to articulate my understanding in case it helps someone facing the same issue.