
lucasaas98
Hello again!
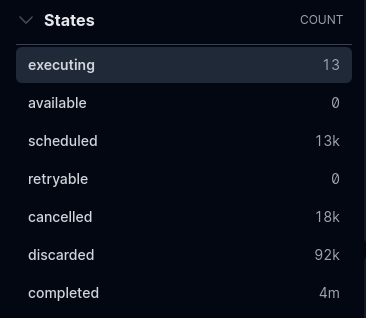
Following yesterday’s topic success we have tried to deploy the new version with the updated code to production but we are running into issues where the database load spikes to 100%. I have a feeling this would not happen if we had shorter pruning time for our jobs table since the same issues does not happen in other environments like our Sandbox environment but would be great to really understand the underlying issue.
For reference, this is the update:
Oban: from 2.17.3 to 2.17.10Oban Pro: from 1.3.0 to 1.4.9Oban Web: from 2.10.2 to 2.10.4
And our database:
- PostgreSQL 13.13
- 2 vcpus
- 7.5GB ram
I have some screenshots and evidence from our Cloud SQL instance that should help to understand the issue, I will include them in details tags so the thread looks nice.


Query 1 and call times

SELECT
  $1
FROM
  "public"."oban_jobs" AS o0
WHERE
  (o0."meta" ? $19)
  AND (o0."meta" ->> $20 = $2)
  AND (o0."meta" ->> $21 IS NULL)
  AND (o0."state" = $3)
UNION ALL (
  SELECT
    $4
  FROM
    "public"."oban_jobs" AS o0
  WHERE
    (o0."meta" ? $22)
    AND (o0."meta" ->> $23 = $5)
    AND (o0."meta" ->> $24 IS NULL)
    AND (o0."state" = $6)
  LIMIT
    $25)
UNION ALL (
  SELECT
    $7
  FROM
    "public"."oban_jobs" AS o0
  WHERE
    (o0."meta" ? $26)
    AND (o0."meta" ->> $27 = $8)
    AND (o0."meta" ->> $28 IS NULL)
    AND (o0."state" = $9)
  LIMIT
    $29)
UNION ALL (
  SELECT
    $10
  FROM
    "public"."oban_jobs" AS o0
  WHERE
    (o0."meta" ? $30)
    AND (o0."meta" ->> $31 = $11)
    AND (o0."meta" ->> $32 IS NULL)
    AND (o0."state" = $12)
  LIMIT
    $33)
UNION ALL (
  SELECT
    $13
  FROM
    "public"."oban_jobs" AS o0
  WHERE
    (o0."meta" ? $34)
    AND (o0."meta" ->> $35 = $14)
    AND (o0."meta" ->> $36 IS NULL)
    AND (o0."state" = $15)
  LIMIT
    $37)
UNION ALL (
  SELECT
    $16
  FROM
    "public"."oban_jobs" AS o0
  WHERE
    (o0."meta" ? $38)
    AND (o0."meta" ->> $39 = $17)
    AND (o0."meta" ->> $40 IS NULL)
    AND (o0."state" = $18)
  LIMIT
    $41)
LIMIT
  $42
Query 2 and call times

SELECT
  $1
FROM
  "public"."oban_jobs" AS o0
WHERE
  (o0."meta" ? $4)
  AND (o0."meta" ->> $5 = $2)
  AND (o0."meta" ->> $6 = $3)
  AND (o0."state" IN ($7,
      $8,
      $9,
      $10,
      $11,
      $12,
      $13))
Query 3 and call times

SELECT
  $1
FROM
  "public"."oban_jobs" AS o0
WHERE
  (o0."meta" ? $13)
  AND (o0."meta" ->> $14 = $2)
  AND (o0."meta" ->> $15 IS NULL)
  AND (o0."state" = $3)
UNION ALL (
  SELECT
    $4
  FROM
    "public"."oban_jobs" AS o0
  WHERE
    (o0."meta" ? $16)
    AND (o0."meta" ->> $17 = $5)
    AND (o0."meta" ->> $18 IS NULL)
    AND (o0."state" = $6)
  LIMIT
    $19)
UNION ALL (
  SELECT
    $7
  FROM
    "public"."oban_jobs" AS o0
  WHERE
    (o0."meta" ? $20)
    AND (o0."meta" ->> $21 = $8)
    AND (o0."meta" ->> $22 IS NULL)
    AND (o0."state" = $9)
  LIMIT
    $23)
UNION ALL (
  SELECT
    $10
  FROM
    "public"."oban_jobs" AS o0
  WHERE
    (o0."meta" ? $24)
    AND (o0."meta" ->> $25 = $11)
    AND (o0."meta" ->> $26 IS NULL)
    AND (o0."state" = $12)
  LIMIT
    $27)
LIMIT
  $28
Any ideas? Did I miss something in the changelogs that could have caused this?
Thanks for the help and sorry for the fat finger ghost thread I created just before 
Where Next?

Trending in Questions



Other Trending Topics


 Latest Oban Threads
Latest on Elixir Forum
Sponsor Spotlight

Error tracking, logs, APM, uptime and cron monitoring in one dev-friendly platform. Find and fix problems before your users notice.
Categories:
Sub Categories:
Forums
Popular Tags
- #ecto
- #liveview
- #troubleshooting
- #learning-elixir
- #library
- #deployment
- #erlang
- #testing
- #genserver
- #mix
- #absinthe
- #remote-other
- #otp
- #plug
- #how-to-question
- #macros
- #postgres
- #elixirconf
- #channels
- #exunit
- #discussion
- #code-sync
- #podcasts
- #javascript
- #onsite
- #dialyzer
- #docker
- #authentication
- #umbrella
- #full-time-contract
- #podcasts-by-brainlid
- #ai
- #ecto-query
- #elixirconf-us
- #blog-post
- #elixir-ls
- #phoenix_html
- #iex
- #graphql
- #genstage
- #websockets
- #supervisor
- #advent-of-code
- #distillery
- #processes
- #elixirconf-eu
- #api
- #forms
- #metaprogramming
- #hex
Our Sponsors

Build Elixir applications with speed and confidence.

Supporting innovation across the BEAM ecosystem.

We build reliable cloud platforms for business-critical systems.

Catch errors, track performance, monitor hosts and more.
Error tracking, logs, uptime, and Just Enough APM. Built for developers.

Practical resources that improve the lives of professional developers.

Bringing learning, work and compliance together since 1987.

The deployment platform built for Elixir: PaaS ease, VPS control.

The team behind Membrane, Popcorn, LiveDebugger. Available for hire.

Courses that'll move you from confusion to "Aha, now I get it!"
Showing Posts 1 to 8- Show Best Posts
- Show All (oldest first)
- Show All (newest first)
benwilson512
Can you
\d oban_jobs? I’m curious to see exactly what indexes are / aren’t in place.As a workaround for efficiently clearing out completed jobs like this I have sometimes used this approach:
This ends up being much faster than a delete + vacuum believe it or not.
Overall I’d consider using partitioned tables if you want millions of jobs around, although Postgres 13 being nearly 4 years old at this point I don’t recall how good its support for partitioned tables is.
sorenone
Heya,
Those ^ are queries from Workflows.
Here is a link to the specific migration that should help!
We’re currently working on better centralized migrations.
lucasaas98
Hey, there, sorry for the late reply.
We were indeed missing the migration mentioned by @sorenone !
It’s a bit sad because we added the DynamicCron remigration but missed the Workflow one
We still had issues with the DB going to 100% even after adding that migration.
@benwilson512 Thanks for the suggestions, I don’t want to clean it manually as we are performing an extraction to BQ so we can keep all the jobs we have ran thus far, for auditability and monitoring. We will change the pruner to 3 days which should already help but it’s not a permanent solution.
But most important, the partitioning suggestion is great and it does work with our instance. I have found this documentation in Oban Pro: Oban.Pro.Plugins.DynamicPartitioner — Oban Pro v1.4.9
This might have other implications so I need to check if it will work for our system.
In any case, thanks for all the suggestions, this already made me realize that our DB is a bit starved for resources and that I need to be better at reading documentation
sorenone
Smidge more:
Are you having heavy load from the same queries? Have you confirmed that the index shows up now (
\d+ oban_jobswill show you).There are some quirks of partitioning. Def read through the docs before making that decision.
lucasaas98
These are the indexes that I see in the DB for the
oban_jobstable:Are we missing any?
sorenone
Nope, they’re all there.
You might need to run
VACUUM ANALYZE oban_jobsto teach it about the workflow index.benwilson512
And to add on to this if you’ve been dealing with a large number of jobs deleted I’d consider a
vacuum full oban_jobsbut do note that this will lock the table while it rebuilds. We’ve had issues with table bloat on theoban_jobstable when we get heavy delete activity.lucasaas98
I tried this out yesterday but I got the same results of database usage spikes in production.
Is this still needed when using Cloud SQL instances? I know that it calls auto-vacuum automatically but not sure if it’s the same as doing full or not. But I don’t think we have a very crazy amount of deleted.
I am focusing on other problems for the rest of the week but will try to give you an update once we get around to trying the upgrade again.