Sure!
I’m assuming you’re running this in MIX_ENV=prod. If so, in your prod.exs file add:
config :logger, level: :debug
You may already have a config :logger entry, in which case just change the level to debug.
Sure!
I’m assuming you’re running this in MIX_ENV=prod. If so, in your prod.exs file add:
config :logger, level: :debug
You may already have a config :logger entry, in which case just change the level to debug.
Thanks. Additionally, I will drop all parallel inserts in favour of insert_all. That will take me a day or two perhaps. Then i will use the query time analysis skills that I learned from you today and see if my problem persists. I will say good bye for now but can’t thank you enough.
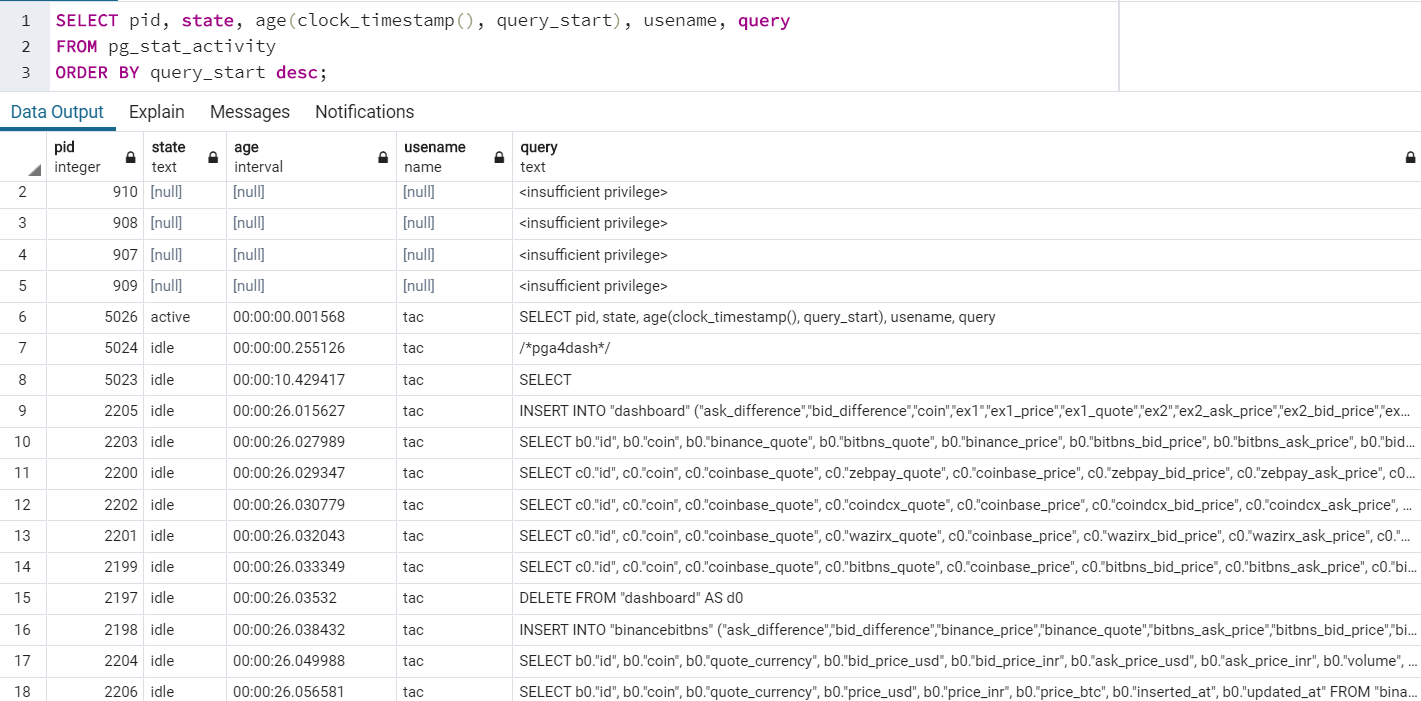
You could also change slightly the query that @benwilson512 recommended to get more output:
SELECT pid, state, age(clock_timestamp(), query_start), usename, query
FROM pg_stat_activity
ORDER BY query_start desc;
It really seems that something is blocking the parallel inserts (table lock?), and they all then complete in milliseconds after this lock is released.
Are you running something periodically every minute or so? Or maybe the delete_all right before the inserts triggers vacuuming or something? It still should not cause such a delay, but TRUNCATE is a lot more efficient than DELETE when deleting all rows from a table, especially if complex indexes are involved (not sure, maybe Ecto already creates a TRUNCATE when using delete_all with no conditions).
Noted. Yes in the post I did mention I am calling a few APIs and then inserting them in tables every 2 minutes. i dont think Ecto has any truncate function, so using delete_all.

How do you truncate a table in ecto? might be useful.
Thanks but is it better than Repo.delete_all ?
It is, but for so few rows this shouldn’t be an issue. Were you ever able to get logs from phoenix?
What’s interesting is I was going to reply to him by linking to the source code of Repo.delete_all since it’s linked to in the docs. Because I was curious to see what it did under the hood too.
But the link to the source code lead to a callback and many other levels of abstraction to the point where I couldn’t determine what query is even run when Repo.delete_all is executed.
Do you (or anyone) have any tips on how to trace the source code to quickly get to the “real” code being run?
Not really. Ecto.Repo isn’t the implementation, but MyApp.Repo is. And it’s code is put there by a bunch of macro logic of use Ecto.Repo.
Yes I did. The log files are quite long so, pasting the last few lines.
DELETE FROM "dashboard" AS d0 []
^[[0m^[[36m13:15:45.385 [debug] QUERY OK source="coinbasebitbns" db=0.5ms idle=22.1ms
SELECT c0."id", c0."coin", c0."coinbase_quote", c0."bitbns_quote", c0."coinbase_price", c0."bitbns_bid_price", c0."bitbns_ask_price", c0."bid_difference", c0."ask_difference", c0."bitbns_volume", c0."inserted$
^[[0m^[[36m13:15:45.386 [debug] QUERY OK source="coinbasewazirx" db=0.4ms idle=22.2ms
SELECT c0."id", c0."coin", c0."coinbase_quote", c0."wazirx_quote", c0."coinbase_price", c0."wazirx_bid_price", c0."wazirx_ask_price", c0."bid_difference", c0."ask_difference", c0."wazirx_volume", c0."inserted$
^[[0m^[[36m13:15:45.387 [debug] QUERY OK source="coinbasecoindcx" db=0.4ms idle=21.1ms
SELECT c0."id", c0."coin", c0."coinbase_quote", c0."coindcx_quote", c0."coinbase_price", c0."coindcx_bid_price", c0."coindcx_ask_price", c0."bid_difference", c0."ask_difference", c0."coindcx_volume", c0."inse$
^[[0m^[[36m13:15:45.388 [debug] QUERY OK source="coinbasezebpay" db=0.3ms queue=0.1ms idle=20.2ms
SELECT c0."id", c0."coin", c0."coinbase_quote", c0."zebpay_quote", c0."coinbase_price", c0."zebpay_bid_price", c0."zebpay_ask_price", c0."bid_difference", c0."ask_difference", c0."zebpay_volume", c0."inserted$
^[[0m^[[36m13:15:45.389 [debug] QUERY OK source="binancebitbns" db=0.9ms idle=19.3ms
SELECT b0."id", b0."coin", b0."binance_quote", b0."bitbns_quote", b0."binance_price", b0."bitbns_bid_price", b0."bitbns_ask_price", b0."bid_difference", b0."ask_difference", b0."bitbns_volume", b0."inserted_a$
^[[0m^[[32m13:15:45.403 [debug] QUERY OK db=10.2ms idle=22.4ms
INSERT INTO "dashboard" ("ask_difference","bid_difference","coin","ex1","ex1_price","ex1_quote","ex2","ex2_ask_price","ex2_bid_price","ex2_quote","ex2_volume","inserted_at","updated_at") VALUES ($1,$2,$3,$4,$$
^[[0m
As far as I can see, the DB operations are happening in a few milliseconds. Also, the your psql query results are
  pid  | state  |       age       | usename  |

                                                                                                                                         query


------+--------+-----------------+----------+-----------------------------------------------------------------------------------------------------------------------------------------------------------------------------------------------------------------------------------------------------------------------------------------------------------------------------------------------------------------------------------------------------------------------------------------------------------------------------------------------------------------------------------------------------------------------------------------------------------------------------------------------------------------------------------------------------------------------------------------------------------------------------------------------------------------------------------------------------------------------------------------------------------------------------------------------------------------------------------------------------------------------------------------------------------------
  912 |        |                 | postgres |
  910 |        |                 |          |
  908 |        |                 |          |
  907 |        |                 |          |
  909 |        |                 |          |
 5054 | active | 00:00:00.000853 | postgres | SELECT pid, state, age(clock_timestamp(), query_start), usename, query


                        +
      |        |                 |          | FROM pg_stat_activity


                        +
      |        |                 |          | ORDER BY query_start desc;
 5024 | idle   | 00:00:00.067315 | tac      | /*pga4dash*/


                        +
      |        |                 |          | SELECT 'session_stats' AS chart_name, row_to_json(t) AS chart_data


                        +
      |        |                 |          | FROM (SELECT


                        +
      |        |                 |          |    (SELECT count(*) FROM pg_stat_activity WHERE datname = (SELECT datname FROM pg_database WHERE oid = 16386)) AS "Total",


                        +
      |        |                 |          |    (SELECT count(*) FROM pg_stat_activity WHERE state = 'active' AND datname = (SELECT datname FROM pg_database WHERE oid = 16386))  AS "Active",


                        +
      |        |                 |          |    (SELECT count(*) FROM pg_stat_activity WHERE state = 'idle' AND datname = (SELECT datname FROM pg_database WHERE oid = 16386))  AS "Idle"


                        +
      |        |                 |          | ) t


                        +
      |        |                 |          | UNION ALL


                        +
      |        |                 |          | SELECT 'tps_stats' AS chart_name, row_to_json(t) AS chart_data


                        +
      |        |                 |          | FROM (SELECT


                        +
      |        |                 |          |    (SELECT sum(xact_commit) + sum(xact_rollback) FROM pg_stat_database WHERE datname = (SELECT datname FROM pg_database WHERE oid = 16386)) AS "Transactions",


                        +
      |        |                 |          |    (SELECT sum(xact_commit) FROM pg_stat_database WHERE datname = (SELECT datname FROM pg_database WHERE oid = 16386)) AS "Commits",


                        +
      |        |                 |          |    (SELECT sum(xact_rollback) FROM pg_stat_database WHERE datname = (SELECT datname FROM pg_database WHERE oid = 16386)) AS "Rollbacks"


                        +
      |        |                 |          | )
 2206 | idle   | 00:00:04.780014 | tac      | SELECT c0."id", c0."amount", c0."pair", c0."inserted_at", c0."updated_at" FROM "currencies" AS c0 WHERE (c0."pair" = $1)
 2205 | idle   | 00:00:04.783775 | tac      | DELETE FROM "coinbase" AS c0
 2203 | idle   | 00:00:04.786723 | tac      | INSERT INTO "currencies" ("amount","pair","inserted_at","updated_at") VALUES ($1,$2,$3,$4) ON CONFLICT ("pair") DO UPDATE SET "amount" = EXCLUDED."amount","updated
_at" = EXCLUDED."updated_at" RETURNING "id"
 2200 | idle   | 00:02:35.142986 | tac      | SELECT b0."id", b0."coin", b0."binance_quote", b0."bitbns_quote", b0."binance_price", b0."bitbns_bid_price", b0."bitbns_ask_price", b0."bid_difference", b0."ask_di
fference", b0."bitbns_volume", b0."inserted_at", b0."updated_at" FROM "binancebitbns" AS b0
 2202 | idle   | 00:02:35.144024 | tac      | SELECT c0."id", c0."coin", c0."coinbase_quote", c0."zebpay_quote", c0."coinbase_price", c0."zebpay_bid_price", c0."zebpay_ask_price", c0."bid_difference", c0."ask_
difference", c0."zebpay_volume", c0."inserted_at", c0."updated_at" FROM "coinbasezebpay" AS c0
 2201 | idle   | 00:02:35.144974 | tac      | SELECT c0."id", c0."coin", c0."coinbase_quote", c0."coindcx_quote", c0."coinbase_price", c0."coindcx_bid_price", c0."coindcx_ask_price", c0."bid_difference", c0."a
sk_difference", c0."coindcx_volume", c0."inserted_at", c0."updated_at" FROM "coinbasecoindcx" AS c0
 2199 | idle   | 00:02:35.146087 | tac      | SELECT c0."id", c0."coin", c0."coinbase_quote", c0."wazirx_quote", c0."coinbase_price", c0."wazirx_bid_price", c0."wazirx_ask_price", c0."bid_difference", c0."ask_
difference", c0."wazirx_volume", c0."inserted_at", c0."updated_at" FROM "coinbasewazirx" AS c0
 2197 | idle   | 00:02:35.147666 | tac      | SELECT c0."id", c0."coin", c0."coinbase_quote", c0."bitbns_quote", c0."coinbase_price", c0."bitbns_bid_price", c0."bitbns_ask_price", c0."bid_difference", c0."ask_
difference", c0."bitbns_volume", c0."inserted_at", c0."updated_at" FROM "coinbasebitbns" AS c0
 2198 | idle   | 00:02:35.150304 | tac      | DELETE FROM "dashboard" AS d0
 2204 | idle   | 00:02:35.15318  | tac      | INSERT INTO "binancebitbns" ("ask_difference","bid_difference","binance_price","binance_quote","bitbns_ask_price","bitbns_bid_price","bitbns_quote","bitbns_volume"
,"coin","inserted_at","updated_at") VALUES ($1,$2,$3,$4,$5,$6,$7,$8,$9,$10,$11),($12,$13,$14,$15,$16,$17,$18,$19,$20,$21,$22),($23,$24,$25,$26,$27,$28,$29,$30,$31,$32,$33),($34,$35,$36,$37,$38,$39,$40,$41,$42,
$43,$44),($45,$46,$47,$48,$49,$50,$51,$52,$53,$54,$55),($56,$57,$58,$59,$60,$61,$62,$63,$64,$65,$66),($67,$68,$69,$70,$71,$72,$73,$74,$75,$76,$77),($78,$79,$80,$81,$82,$83,$84,$85,$86,$87,$88),($89,$90,$91,$92
,$93,$94,$95,$96,$97,$98,$99),($100,$101,$102,$103,$104,$105,$106,$107,$108,$109,$110),($111,$112,$113,$114,$115,$116,$117,$118,$119,$120,$121),($122,$123,$124,$125,$126,$127,$128,$129,$130,$131,$132),($133,$1
34,$135,$136,$137,$138,$139,$140,$141,$142,$143),($144,$145,$146,$147,$148,$149,$150,$151,$152,$153,$154),($155,$156,$157,$158,$159,$160,$161,$162,$163,$164,$165),($166,$167,$168,$169,$170,$171,$172,$173,$174,
$175,$176),($177,$178,$1
 5026 | idle   | 00:07:53.968991 | tac      | SELECT n.nspname, r.relname


                        +
      |        |                 |          | FROM pg_class r


                        +
      |        |                 |          |     LEFT JOIN pg_namespace n ON (r.relnamespace = n.oid)


                        +
      |        |                 |          | WHERE r.oid = 11750;


                        +
      |        |                 |          |
 5023 | idle   | 00:08:05.233892 | tac      | SELECT


                        +
      |        |                 |          |     db.oid as did, db.datname as name, ta.spcname as spcname, db.datallowconn,


                        +
      |        |                 |          |     has_database_privilege(db.oid, 'CREATE') as cancreate, datdba as owner


                        +
      |        |                 |          | FROM


                        +
      |        |                 |          |     pg_database db


                        +
      |        |                 |          |     LEFT OUTER JOIN pg_tablespace ta ON db.dattablespace = ta.oid


                        +
      |        |                 |          | WHERE db.oid > 13090::OID


                        +
      |        |                 |          |


                        +
      |        |                 |          | ORDER BY datname;
(19 rows)
What I can make out from the above is all the DB operations are happening quickly, coz they are shown as idle, right ?
I also replaced all parallel inserts with insert_all, but to no avail. Still at 100% CPU
Why do you think age(clock_timestamp(), query_start) means the time taken to complete the transaction ? I think it shows time passed since the query started. I checked the logs, and all my queries get done in a few milliseconds.
I think the query I gave you is too broad, as now you see all the idle queries too, which are not very informative. Maybe something like:
SELECT pid, state, age(clock_timestamp(), query_start), xact_start, waiting, query
FROM pg_stat_activity
WHERE state IN ('active', 'idle in transaction')
ORDER BY query_start desc;
This should show you queries that are either active or stuck in a transaction. It also shows now if the query is waiting on a lock.
That said, you should also investigate in other directions, as your code could be optimized, but should not cause such a big CPU utilization given the numbers. You said only you are using the app. Do you see other queries being issued to the database, apart from the ones coming from the app? Is there anything else connecting to the same database?
Ran your query. Nothing is stuck in transaction
 pid  | state  |       age       |          xact_start           |                                   query
------+--------+-----------------+-------------------------------+---------------------------------------------------------------------------
 5054 | active | 00:00:00.000806 | 2020-04-17 14:04:19.192267+00 | SELECT pid, state, age(clock_timestamp(), query_start), xact_start, query+
      |        |                 |                               | FROM pg_stat_activity                                                    +
      |        |                 |                               | WHERE state IN ('active', 'idle in transaction')                         +
      |        |                 |                               | ORDER BY query_start desc;
(1 row)
My app is pretty simple one , calls a few APIs and saves in DB (all of this happens in millliseconds), then it waits for 2 mins and just repeats it. It is the sole app running in my droplet. So, this is the only app talking to the DB. Apart from PGadmin on my client, nothing else is connected.
Also the two postgres PIDs that are consuming 100% CPU are nowhere to be seen in pg_stat_activity
Try again a few times, maybe also adding the waiting column in the SELECT, as I did in my previous post (I edited it), to see if you catch anything. The other day it was reporting the INSERT queries taking a long time, but we did not know if they were waiting on a lock. Also, we were not including queries idle in transaction.
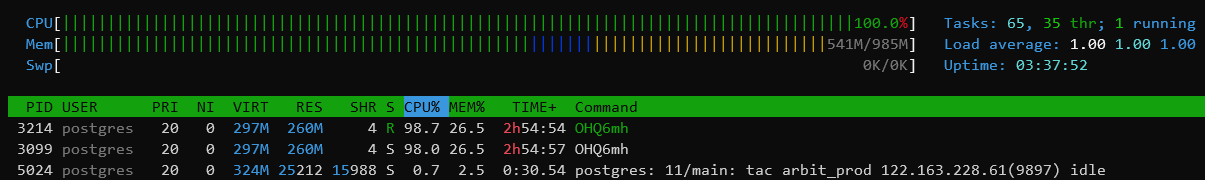
Another question: your first screenshot shows two processes from the postgres user. What are they? Can you check with ps aux | grep postgres (PostgresSQL modifies the command as shown by ps in order to make it easier to identify which process is what)?
Column waiting doesn’t exist in the pg_stat_activity table.
I myself don’t know what are these two processes ? These are the culprit who are taking 100% CPU.
And this is the result for ps aux | grep postgres
postgres   902  0.0  2.6 320860 27192 ?        S    10:55   0:00 /usr/lib/postgresql/11/bin/postgres -D /var/lib/postgresql/11/main -c config_file=/etc/postgresql/11/main/postgresql.conf
postgres   907  0.0  1.1 321008 11348 ?        Ss   10:55   0:00 postgres: 11/main: checkpointer
postgres   908  0.0  0.7 320860  7624 ?        Ss   10:55   0:00 postgres: 11/main: background writer
postgres   909  0.0  0.8 320860  8992 ?        Ss   10:55   0:01 postgres: 11/main: walwriter
postgres   910  0.0  0.7 321396  7472 ?        Ss   10:55   0:00 postgres: 11/main: autovacuum launcher
postgres   911  0.0  0.4 176044  4488 ?        Ss   10:55   0:02 postgres: 11/main: stats collector
postgres   912  0.0  0.6 321260  6548 ?        Ss   10:55   0:00 postgres: 11/main: logical replication launcher
postgres  2197  0.0  2.5 327760 26100 ?        Ss   11:01   0:00 postgres: 11/main: tac arbit_prod 127.0.0.1(38499) idle
postgres  2198  0.0  2.6 328856 26684 ?        Ss   11:01   0:00 postgres: 11/main: tac arbit_prod 127.0.0.1(39825) idle
postgres  2199  0.0  2.4 327404 24628 ?        Ss   11:01   0:00 postgres: 11/main: tac arbit_prod 127.0.0.1(43823) idle
postgres  2200  0.0  2.4 327448 25044 ?        Ss   11:01   0:00 postgres: 11/main: tac arbit_prod 127.0.0.1(57623) idle
postgres  2201  0.0  2.5 327596 25592 ?        Ss   11:01   0:00 postgres: 11/main: tac arbit_prod 127.0.0.1(34135) idle
postgres  2202  0.0  2.5 327520 25888 ?        Ss   11:01   0:00 postgres: 11/main: tac arbit_prod 127.0.0.1(50855) idle
postgres  2203  0.0  2.4 327764 25060 ?        Ss   11:01   0:00 postgres: 11/main: tac arbit_prod 127.0.0.1(38189) idle
postgres  2204  0.0  2.5 327608 25328 ?        Ss   11:01   0:00 postgres: 11/main: tac arbit_prod 127.0.0.1(59471) idle
postgres  2205  0.0  2.5 327844 25372 ?        Ss   11:01   0:00 postgres: 11/main: tac arbit_prod 127.0.0.1(60961) idle
postgres  2206  0.0  2.5 327688 25728 ?        Ss   11:01   0:00 postgres: 11/main: tac arbit_prod 127.0.0.1(39093) idle
postgres  2614  0.0  0.0   2256    76 ?        Ss   11:06   0:00 Y5kubC
postgres  3099 92.8 26.4 305032 267012 ?       Ssl  11:25 172:18 OHQ6mh
postgres  5023  0.0  1.6 322132 16820 ?        Ss   13:13   0:00 postgres: 11/main: tac postgres 122.163.228.61(60374) idle
postgres  5024  0.6  2.4 332404 25212 ?        Ss   13:13   0:29 postgres: 11/main: tac arbit_prod 122.163.228.61(9897) idle
postgres  5026  0.0  2.0 324128 20632 ?        Ss   13:13   0:00 postgres: 11/main: tac arbit_prod 122.163.228.61(60435) idle
root      5033  0.0  0.4  64208  4332 pts/0    S    13:13   0:00 sudo -i -u postgres
postgres  5036  0.0  0.4  23116  4844 pts/0    S    13:13   0:00 -bash
postgres  5046  0.0  0.9 118636  9272 pts/0    S+   13:14   0:00 /usr/lib/postgresql/11/bin/psql arbit_prod
postgres  5054  0.0  1.9 329352 19452 ?        Ss   13:14   0:00 postgres: 11/main: postgres arbit_prod [local] idle
tac       6277  0.0  0.1  14856  1144 pts/2    S+   14:30   0:00 grep --color=auto postgres
I can notice pid 3099 is present in both, but don’t knwo what to make out of it.
You can see that the process with PID 3099 is the one using all the CPU. It is not the Postgres master, and also not one of the processes handling client connections from your app (those are the ones with postgres: 11/main: tac arbit_prod). You need to figure out what that process is (the command field set to some random characters, OHQ6mh, is definitely weird).
At this point though, it is very unlikely that the problem is in your Phoenix app logic.
Thanks for stating that my Phoenix app is not the issue. I knew it cant be but a second opinion does make me feel better. Yes, that wierd command doesnt return any google results too . I dont know how can I find out anything about it. When I restart my droplet, CPU is at 1%, then after a few minutes this process appears and takes my CPU at 100%, happens always. Should I try reinstalling postgres and see if it changes anything ?
In your investigation, consider that ps or htop is just telling us that this process executes with the postgres user. It does not necessarily imply that it is actually related to PostgreSQL. The strange command field makes me suspect it is something else, running with the postgres user.
Interesting. Noted. I always create a new user whenever I install postgres anywhere. Standard practice. I never do anything with the postgres user. Anyway, thanks for your insights.


© Copyright Elixir Forum | Terms | Privacy & Cookies